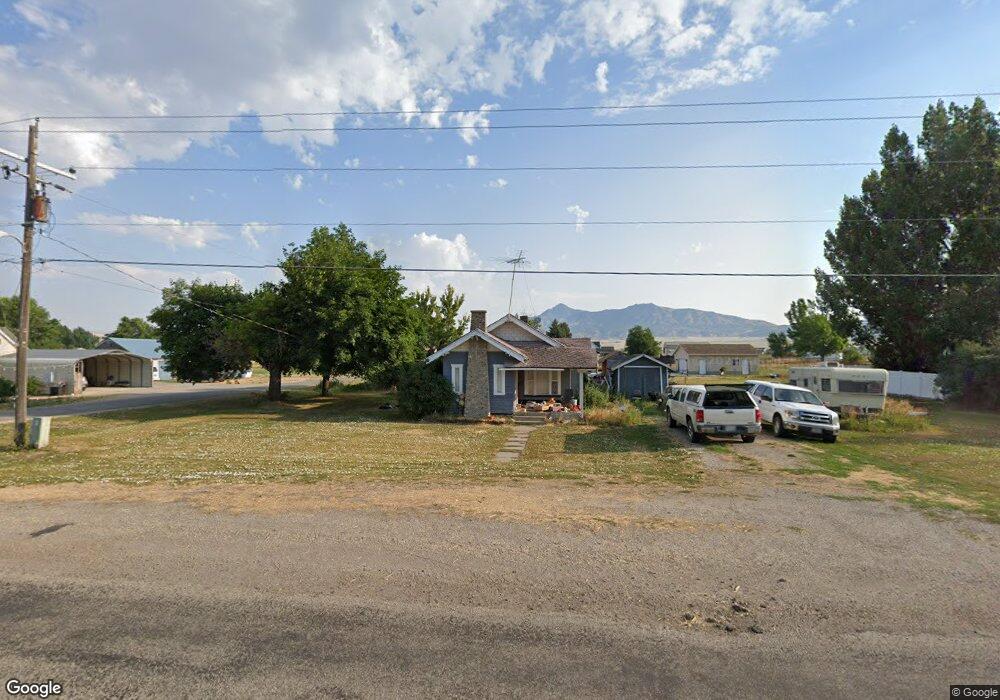
280 W Main St Fielding, UT 84311
Estimated Value: $263,000 - $443,000
1
Bed
1
Bath
794
Sq Ft
$415/Sq Ft
Est. Value
About This Home
This home is located at 280 W Main St, Fielding, UT 84311 and is currently estimated at $329,435, approximately $414 per square foot. 280 W Main St is a home located in Box Elder County with nearby schools including Fielding School, Bear River Middle School, and Alice C. Harris Intermediate School.
Create a Home Valuation Report for This Property
The Home Valuation Report is an in-depth analysis detailing your home's value as well as a comparison with similar homes in the area
Tax History
| Year | Tax Paid | Tax Assessment Tax Assessment Total Assessment is a certain percentage of the fair market value that is determined by local assessors to be the total taxable value of land and additions on the property. | Land | Improvement |
|---|---|---|---|---|
| 2025 | $1,300 | $248,855 | $130,000 | $118,855 |
| 2024 | $1,131 | $247,011 | $130,000 | $117,011 |
| 2023 | $1,126 | $248,593 | $130,000 | $118,593 |
| 2022 | $991 | $112,940 | $35,750 | $77,190 |
| 2021 | $638 | $115,059 | $30,000 | $85,059 |
| 2020 | $659 | $115,059 | $30,000 | $85,059 |
| 2019 | $605 | $55,486 | $16,500 | $38,986 |
| 2018 | $590 | $50,400 | $16,500 | $33,900 |
| 2017 | $611 | $91,637 | $16,500 | $61,637 |
| 2016 | $608 | $48,786 | $16,500 | $32,286 |
| 2015 | $566 | $45,851 | $16,500 | $29,351 |
| 2014 | $566 | $44,453 | $16,500 | $27,953 |
| 2013 | -- | $41,912 | $16,500 | $25,412 |
Source: Public Records
Map
Nearby Homes
- 95 W 100 N
- 95 E 100 S
- 303 S Center St
- 16580 N 5200 W
- 15920 N 4000 W Unit 14
- 18100 N 4400 W
- 18120 N 4400 W
- 18250 N 4400 W
- 5855 W 16800 N
- 15290 N 4950 W
- 5601 W 15200 N
- 18188 N 6000 W
- 4840 W 14400 N
- 4881 W 14400 N
- 19040 N Wendell Way
- 14296 N 5350 W
- 13275 N Brookside Dr Unit 12
- 19188 N Wendell Way
- 3536 W 14100 N
- 1175 E 1150 S
Your Personal Tour Guide
Ask me questions while you tour the home.