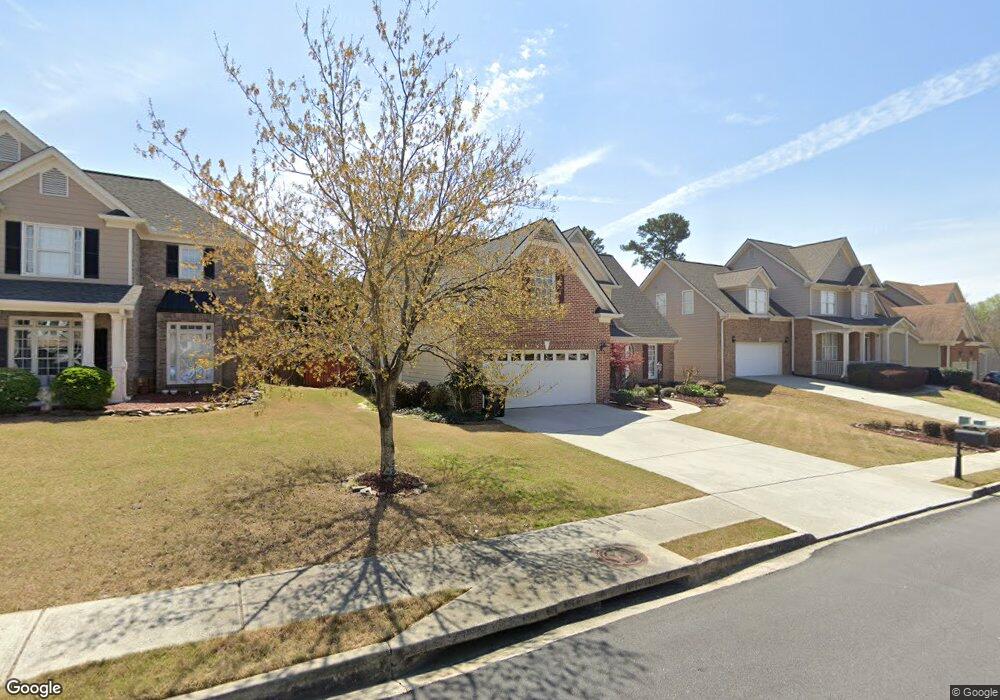
280 Wild Barley Way Unit 5 Loganville, GA 30052
Estimated Value: $380,000 - $435,000
4
Beds
4
Baths
1,734
Sq Ft
$230/Sq Ft
Est. Value
About This Home
This home is located at 280 Wild Barley Way Unit 5, Loganville, GA 30052 and is currently estimated at $399,085, approximately $230 per square foot. 280 Wild Barley Way Unit 5 is a home located in Gwinnett County with nearby schools including Trip Elementary School, Bay Creek Middle School, and Grayson High School.
Ownership History
Date
Name
Owned For
Owner Type
Purchase Details
Closed on
Oct 23, 2018
Sold by
Ambrose Magnolia J
Bought by
Ambrose Magnolia J and Hutchinson Kameron O
Current Estimated Value
Purchase Details
Closed on
Apr 12, 2010
Sold by
Lewis George A
Bought by
Ambrose Magnolia J
Purchase Details
Closed on
Nov 23, 2009
Sold by
Lewis Kristen C
Bought by
Lewis George A
Home Financials for this Owner
Home Financials are based on the most recent Mortgage that was taken out on this home.
Original Mortgage
$175,000
Interest Rate
4.98%
Mortgage Type
New Conventional
Purchase Details
Closed on
Nov 16, 2004
Sold by
Colex Pascul A and Colex Patricia
Bought by
Lewis George A and Lewis Kristen
Home Financials for this Owner
Home Financials are based on the most recent Mortgage that was taken out on this home.
Original Mortgage
$214,000
Interest Rate
5.6%
Purchase Details
Closed on
Feb 24, 2004
Sold by
Cmg Const Inc
Bought by
Coley Pascul A and Coley Patricia
Create a Home Valuation Report for This Property
The Home Valuation Report is an in-depth analysis detailing your home's value as well as a comparison with similar homes in the area
Home Values in the Area
Average Home Value in this Area
Purchase History
| Date | Buyer | Sale Price | Title Company |
|---|---|---|---|
| Ambrose Magnolia J | -- | -- | |
| Ambrose Magnolia J | $210,500 | -- | |
| Lewis George A | -- | -- | |
| Lewis George A | $214,000 | -- | |
| Coley Pascul A | $213,500 | -- |
Source: Public Records
Mortgage History
| Date | Status | Borrower | Loan Amount |
|---|---|---|---|
| Previous Owner | Lewis George A | $175,000 | |
| Previous Owner | Lewis George A | $214,000 |
Source: Public Records
Tax History Compared to Growth
Tax History
| Year | Tax Paid | Tax Assessment Tax Assessment Total Assessment is a certain percentage of the fair market value that is determined by local assessors to be the total taxable value of land and additions on the property. | Land | Improvement |
|---|---|---|---|---|
| 2024 | $4,094 | $141,320 | $36,000 | $105,320 |
| 2023 | $4,094 | $135,960 | $36,800 | $99,160 |
| 2022 | $3,646 | $121,200 | $31,200 | $90,000 |
| 2021 | $3,087 | $91,720 | $22,800 | $68,920 |
| 2020 | $3,108 | $91,720 | $22,800 | $68,920 |
| 2019 | $2,874 | $85,160 | $22,800 | $62,360 |
| 2018 | $2,926 | $85,160 | $22,800 | $62,360 |
| 2016 | $2,766 | $76,800 | $20,000 | $56,800 |
| 2015 | $2,621 | $70,360 | $13,600 | $56,760 |
| 2014 | -- | $66,320 | $13,600 | $52,720 |
Source: Public Records
Map
Nearby Homes
- 3042 Blue Creek Path
- 3145 Sweet Basil Ln
- 542 Silvermoon Dr
- 544 Silvermoon Dr
- 546 Silvermoon Dr
- 540 Silvermoon Dr
- 565 Silvermoon Dr
- 375 Silvermoon Dr
- 425 Silvermoon Dr
- 556 Silvermoon Dr
- 405 Silvermoon Dr
- 552 Silvermoon Dr
- 385 Silvermoon Dr
- 550 Silvermoon Dr
- 239 Hope Hollow Rd
- 2487 Rathburn Cir
- 3016 Loganville Hwy
- 567 Silver Moon Dr
- 565 Silver Moon Dr
- 2790 Meadow Gate Way
- 270 Wild Barley Way Unit 4
- 270 Wild Barley Way
- 290 Wild Barley Way
- 260 Wild Barley Way
- 260 Wild Barley Way
- 300 Wild Barley Way
- 3010 Sweet Basil Ln
- 3020 Sweet Basil Ln Unit 4
- 285 Wild Barley Way
- 285 Wild Barley Way Unit 330 and 332
- 250 Wild Barley Way
- 310 Wild Barley Way Unit 1
- 3030 Sweet Basil Ln
- 295 Wild Barley Way Unit 4
- 275 Wild Barley Way
- 3030 Sweet Basil Ln SW
- 3002 Blue Creek Path Unit 2
- 3000 Sweet Basil Ln
- 3000 Sweet Basil Ln Unit 35
- 0 Wild Barley Way