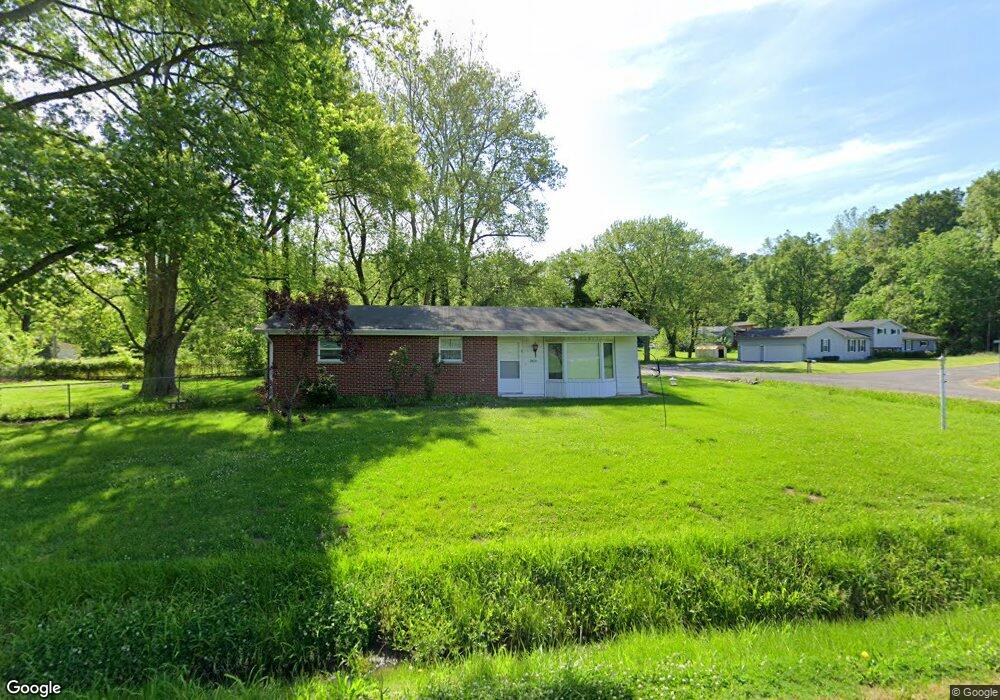
2800 Dutch Hollow Rd Belleville, IL 62223
Estimated Value: $104,729 - $164,000
--
Bed
--
Bath
974
Sq Ft
$144/Sq Ft
Est. Value
About This Home
This home is located at 2800 Dutch Hollow Rd, Belleville, IL 62223 and is currently estimated at $140,576, approximately $144 per square foot. 2800 Dutch Hollow Rd is a home located in St. Clair County with nearby schools including Katie Harper-Wright Elementary School, Mason/Clark Middle School, and East St Louis Senior High School.
Ownership History
Date
Name
Owned For
Owner Type
Purchase Details
Closed on
Dec 5, 2016
Sold by
Fehlhaber Sue E
Bought by
Richardson Kelly J
Current Estimated Value
Purchase Details
Closed on
Nov 29, 2011
Sold by
Fehlhaber Sue
Bought by
Fehlhaber Sue
Purchase Details
Closed on
Jan 17, 2011
Sold by
Bennett Rebecca
Bought by
Fehlhaber Sue
Purchase Details
Closed on
Nov 16, 1998
Sold by
Argo Elizabeth M
Bought by
Wolfsberger James P
Create a Home Valuation Report for This Property
The Home Valuation Report is an in-depth analysis detailing your home's value as well as a comparison with similar homes in the area
Home Values in the Area
Average Home Value in this Area
Purchase History
| Date | Buyer | Sale Price | Title Company |
|---|---|---|---|
| Richardson Kelly J | -- | None Available | |
| Fehlhaber Sue | -- | None Available | |
| Fehlhaber Sue | -- | None Available | |
| Wolfsberger James P | -- | Guaranty Title |
Source: Public Records
Tax History Compared to Growth
Tax History
| Year | Tax Paid | Tax Assessment Tax Assessment Total Assessment is a certain percentage of the fair market value that is determined by local assessors to be the total taxable value of land and additions on the property. | Land | Improvement |
|---|---|---|---|---|
| 2024 | $3,935 | $30,709 | $2,605 | $28,104 |
| 2023 | $2,794 | $26,837 | $2,555 | $24,282 |
| 2022 | $2,411 | $24,160 | $2,300 | $21,860 |
| 2021 | $2,241 | $22,335 | $2,126 | $20,209 |
| 2020 | $2,258 | $21,121 | $2,010 | $19,111 |
| 2019 | $2,292 | $20,727 | $2,014 | $18,713 |
| 2018 | $2,315 | $20,278 | $1,970 | $18,308 |
| 2017 | $2,314 | $20,135 | $1,956 | $18,179 |
| 2016 | $2,270 | $19,707 | $1,914 | $17,793 |
| 2014 | $2,227 | $20,268 | $1,924 | $18,344 |
| 2013 | $1,797 | $20,558 | $1,952 | $18,606 |
Source: Public Records
Map
Nearby Homes
- 0 Holdener Dr
- 1 AC Highridge Dr
- 9629 Holdener Place
- 212 Woodcrest Dr
- 80 N 98th St
- 20 Hilldale Dr
- 6 N 95th St
- 11 Greenwood Ct
- 6 Hilltop Place
- 10 Hill Dr Unit . A, B, C
- 10 Hill Dr Unit D, E, F
- 31 S 97th St
- 24 S 95th St
- 14 Granvue Dr
- 100 S 98th St
- 8612 Main St W
- 38 Granvue Dr
- 134 N 82nd St
- 1314 Dutch Hollow Rd
- 38 S 86th St