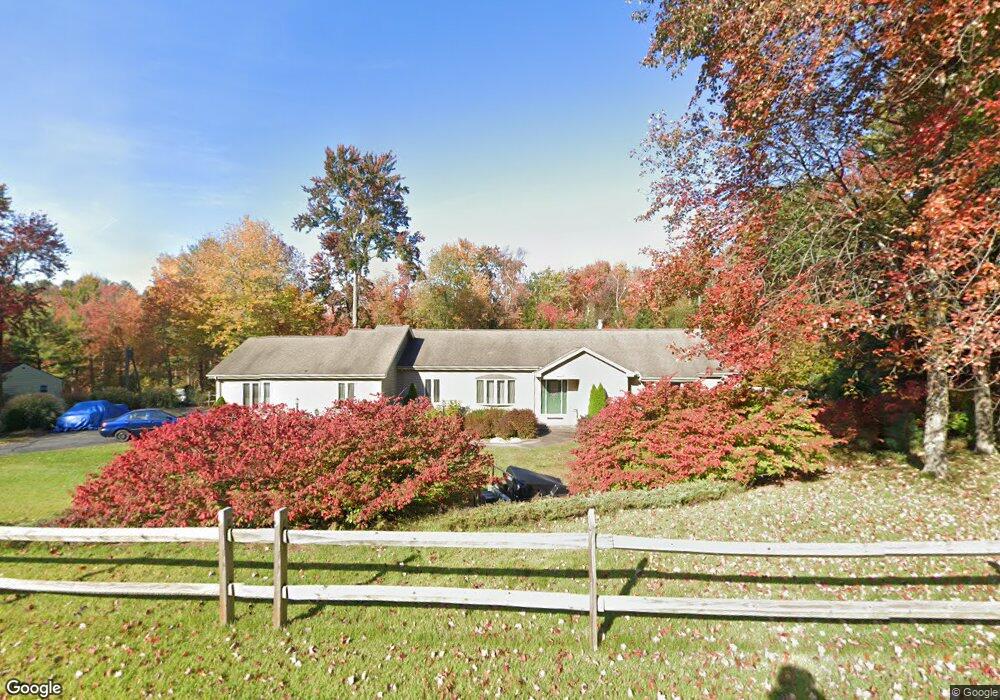
2800 Ellington Rd South Windsor, CT 06074
Estimated Value: $527,000 - $609,000
3
Beds
3
Baths
2,108
Sq Ft
$273/Sq Ft
Est. Value
About This Home
This home is located at 2800 Ellington Rd, South Windsor, CT 06074 and is currently estimated at $576,122, approximately $273 per square foot. 2800 Ellington Rd is a home located in Hartford County with nearby schools including Timothy Edwards School and South Windsor High School.
Ownership History
Date
Name
Owned For
Owner Type
Purchase Details
Closed on
Dec 21, 2010
Sold by
Fhlmc
Bought by
Lezon Frederick and Do Lisa
Current Estimated Value
Purchase Details
Closed on
Feb 2, 2010
Sold by
Gmac Mortgage Llc
Bought by
Fhlmc
Purchase Details
Closed on
Jun 2, 2004
Sold by
Hathorn Adam and Hathorn Nellie
Bought by
Cianci William
Home Financials for this Owner
Home Financials are based on the most recent Mortgage that was taken out on this home.
Original Mortgage
$294,500
Interest Rate
5.94%
Purchase Details
Closed on
Nov 18, 2002
Sold by
Ewing Francis
Bought by
Hathorn Adam and Hathorn Mellie
Purchase Details
Closed on
Nov 14, 2000
Sold by
Kasevich Lawrence and Chuck Sandra
Bought by
Oconnell John and Oconnell Frances
Purchase Details
Closed on
Jan 3, 1992
Sold by
Hamid Reshid
Bought by
Kasevich Stanley and Kasevich Mildred
Create a Home Valuation Report for This Property
The Home Valuation Report is an in-depth analysis detailing your home's value as well as a comparison with similar homes in the area
Home Values in the Area
Average Home Value in this Area
Purchase History
| Date | Buyer | Sale Price | Title Company |
|---|---|---|---|
| Lezon Frederick | $255,000 | -- | |
| Fhlmc | -- | -- | |
| Gmac Mortgage Llc | -- | -- | |
| Cianci William | $310,000 | -- | |
| Hathorn Adam | $273,000 | -- | |
| Oconnell John | $225,000 | -- | |
| Kasevich Stanley | $146,000 | -- |
Source: Public Records
Mortgage History
| Date | Status | Borrower | Loan Amount |
|---|---|---|---|
| Previous Owner | Kasevich Stanley | $51,000 | |
| Previous Owner | Kasevich Stanley | $296,500 | |
| Previous Owner | Kasevich Stanley | $294,500 |
Source: Public Records
Tax History Compared to Growth
Tax History
| Year | Tax Paid | Tax Assessment Tax Assessment Total Assessment is a certain percentage of the fair market value that is determined by local assessors to be the total taxable value of land and additions on the property. | Land | Improvement |
|---|---|---|---|---|
| 2025 | $10,462 | $293,800 | $103,800 | $190,000 |
| 2024 | $10,124 | $293,800 | $103,800 | $190,000 |
| 2023 | $9,737 | $293,800 | $103,800 | $190,000 |
| 2022 | $7,870 | $203,000 | $103,800 | $99,200 |
| 2021 | $7,686 | $203,000 | $103,800 | $99,200 |
| 2020 | $7,690 | $203,000 | $103,800 | $99,200 |
| 2019 | $7,816 | $203,000 | $103,800 | $99,200 |
| 2018 | $7,647 | $203,000 | $103,800 | $99,200 |
| 2017 | $7,627 | $200,300 | $103,800 | $96,500 |
| 2016 | $7,479 | $200,300 | $103,800 | $96,500 |
| 2015 | $7,319 | $200,300 | $103,800 | $96,500 |
| 2014 | $7,113 | $200,300 | $103,800 | $96,500 |
Source: Public Records
Map
Nearby Homes
- 2773 Ellington Rd
- 2719 Ellington Rd
- 2560 Ellington Rd
- 68 Kent Ln
- 835 Foster Street Extension
- 59 Saginaw St
- 178 Beelzebub Rd
- 155 New Marker Rd
- 51 Carriage Dr
- 25 Oakview Place
- 88 Andreis Trail
- 29 Shady Brook Ln Unit 29
- 387 Foster St
- 18 Hayes Ave
- 721 Dart Hill Rd
- 76 Griffin Rd
- 360 Felt Rd
- 33 Sunset Terrace
- 11 Kupchunos Rd
- 1 Abbott Rd Unit 85
- 2790 Ellington Rd
- 2814 Ellington Rd
- 2807 Ellington Rd
- 2799 Ellington Rd
- 2824 Ellington Rd
- 2815 Ellington Rd
- 2791 Ellington Rd
- 2780 Ellington Rd
- 2825 Ellington Rd
- 2783 Ellington Rd
- 2837 Ellington Rd
- 33 Niederwerfer Rd
- 25 Niederwerfer Rd
- 43 Niederwerfer Rd
- 15 Niederwerfer Rd
- 55 Niederwerfer Rd
- 2759 Ellington Rd
- 122 Dart Hill Rd
- 2849 Ellington Rd
- 110 Dart Hill Rd