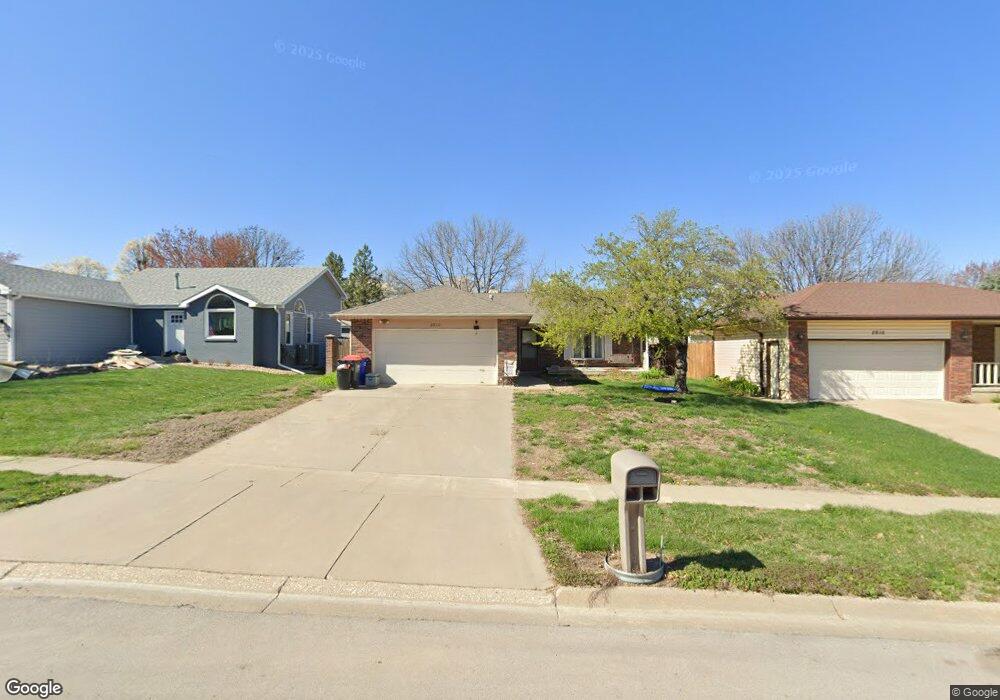
2800 Kipling Cir Lincoln, NE 68516
Estimated Value: $261,000 - $316,000
3
Beds
4
Baths
1,118
Sq Ft
$252/Sq Ft
Est. Value
About This Home
This home is located at 2800 Kipling Cir, Lincoln, NE 68516 and is currently estimated at $282,005, approximately $252 per square foot. 2800 Kipling Cir is a home located in Lancaster County with nearby schools including Rousseau Elementary School, Scott Middle School, and Southwest High School.
Ownership History
Date
Name
Owned For
Owner Type
Purchase Details
Closed on
Jun 29, 2006
Sold by
Huebert Lonnie G and Huebert Krystie L
Bought by
Werndet Llc
Current Estimated Value
Purchase Details
Closed on
Mar 14, 2006
Sold by
Werndet Llc
Bought by
Huebert Lonnie G and Huebert Krystie L
Home Financials for this Owner
Home Financials are based on the most recent Mortgage that was taken out on this home.
Original Mortgage
$93,750
Interest Rate
6.24%
Mortgage Type
Fannie Mae Freddie Mac
Purchase Details
Closed on
Jun 4, 2004
Sold by
Success Enterprises Llc
Bought by
Huebert Lonnie and Huebert Krystie
Purchase Details
Closed on
May 30, 2004
Sold by
Wischmann Delores R
Bought by
Success Enterprises Llc
Purchase Details
Closed on
Jan 30, 2001
Sold by
Wischmann Mark A
Bought by
Wischmann Delores R
Create a Home Valuation Report for This Property
The Home Valuation Report is an in-depth analysis detailing your home's value as well as a comparison with similar homes in the area
Home Values in the Area
Average Home Value in this Area
Purchase History
| Date | Buyer | Sale Price | Title Company |
|---|---|---|---|
| Werndet Llc | -- | None Available | |
| Huebert Lonnie G | -- | Itic | |
| Huebert Lonnie | $122,000 | -- | |
| Success Enterprises Llc | $112,000 | -- | |
| Wischmann Delores R | -- | -- |
Source: Public Records
Mortgage History
| Date | Status | Borrower | Loan Amount |
|---|---|---|---|
| Previous Owner | Huebert Lonnie G | $93,750 |
Source: Public Records
Tax History Compared to Growth
Tax History
| Year | Tax Paid | Tax Assessment Tax Assessment Total Assessment is a certain percentage of the fair market value that is determined by local assessors to be the total taxable value of land and additions on the property. | Land | Improvement |
|---|---|---|---|---|
| 2025 | $3,576 | $273,500 | $54,000 | $219,500 |
| 2024 | $3,576 | $256,200 | $54,000 | $202,200 |
| 2023 | $4,073 | $243,000 | $54,000 | $189,000 |
| 2022 | $3,974 | $199,400 | $50,000 | $149,400 |
| 2021 | $3,760 | $199,400 | $50,000 | $149,400 |
| 2020 | $3,430 | $179,500 | $50,000 | $129,500 |
| 2019 | $3,430 | $179,500 | $50,000 | $129,500 |
| 2018 | $3,244 | $169,000 | $50,000 | $119,000 |
| 2017 | $3,274 | $169,000 | $50,000 | $119,000 |
| 2016 | $3,026 | $155,400 | $45,000 | $110,400 |
| 2015 | $3,005 | $155,400 | $45,000 | $110,400 |
| 2014 | $2,956 | $152,000 | $45,000 | $107,000 |
| 2013 | -- | $152,000 | $45,000 | $107,000 |
Source: Public Records
Map
Nearby Homes
- 2716 Kipling Cir
- 2832 Shelley Cir
- 5701 Briar Rosa Dr
- 2905 Londonshire Ct
- 2844 Jane Ln
- 6006 S 25th St
- 2930 Drawbridge Ct
- 2941 Orwell St
- 6027 S 25th St
- 6216 Briar Rosa Dr
- 2400 S Canterbury Ln
- 2352 Summertime Ct
- 2355 Summertime Ct
- 2351 Springtime Ct
- 2350 Springtime Ct
- 6305 Benjamin Place
- 2342 Summertime Ct
- 2347 Summertime Ct
- 2341 Springtime Ct
- 3119 Shelley St
- 2810 Kipling Cir
- 2820 Kipling Cir
- 2732 Kipling Cir
- 2809 Shelley Cir
- 2801 Shelley Cir
- 2741 Shelley Cir
- 2815 Shelley Cir
- 2801 Kipling Cir
- 2830 Kipling Cir
- 2724 Kipling Cir
- 2823 Shelley Cir
- 2731 Shelley Cir
- 2733 Kipling Cir
- 2840 Kipling Cir
- 2818 Shelley Cir
- 2812 Shelley Cir
- 2721 Shelley Cir
- 2806 Shelley Cir
- 2830 Shelley Cir
- 2836 Shelley Cir