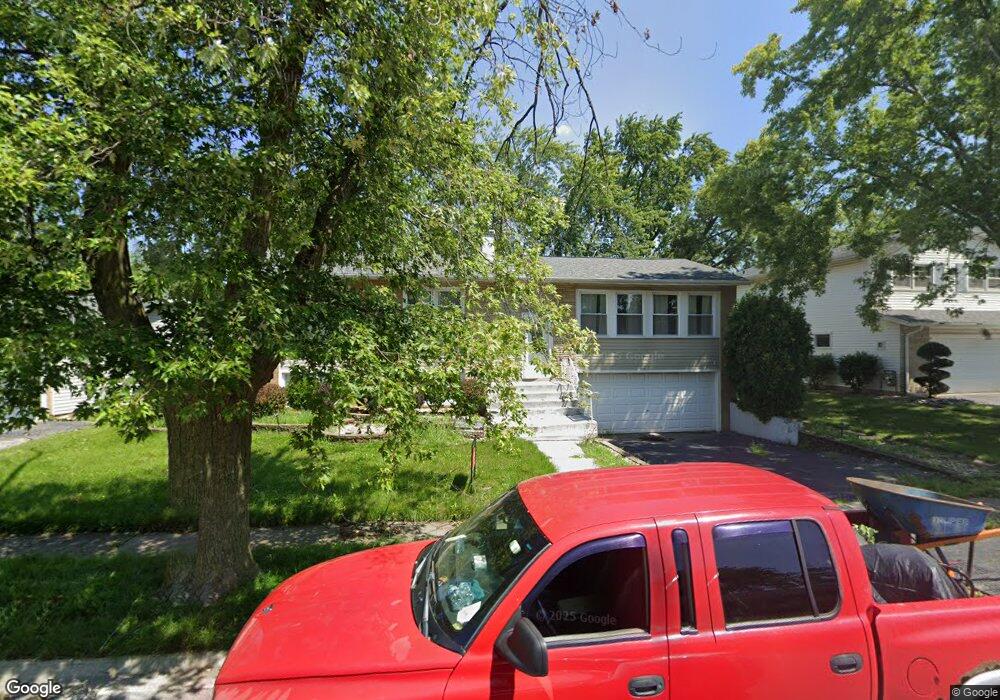
2800 Knollwood Place Hazel Crest, IL 60429
Stonebridge NeighborhoodEstimated Value: $189,000 - $240,691
4
Beds
2
Baths
2,000
Sq Ft
$106/Sq Ft
Est. Value
About This Home
This home is located at 2800 Knollwood Place, Hazel Crest, IL 60429 and is currently estimated at $212,173, approximately $106 per square foot. 2800 Knollwood Place is a home located in Cook County with nearby schools including Willow Elementary School, Winston Churchill School, and James Hart School.
Ownership History
Date
Name
Owned For
Owner Type
Purchase Details
Closed on
Apr 29, 2025
Sold by
Stanley Melissa and Simmons Melissa
Bought by
Onaghama Mercy
Current Estimated Value
Home Financials for this Owner
Home Financials are based on the most recent Mortgage that was taken out on this home.
Original Mortgage
$175,750
Outstanding Balance
$175,151
Interest Rate
6.85%
Mortgage Type
New Conventional
Estimated Equity
$37,022
Purchase Details
Closed on
Nov 18, 2021
Sold by
Robinson Tikia J
Bought by
Simmons Melissa
Home Financials for this Owner
Home Financials are based on the most recent Mortgage that was taken out on this home.
Original Mortgage
$270,019
Interest Rate
4.5%
Mortgage Type
FHA
Purchase Details
Closed on
May 24, 2019
Sold by
Spring Oak Renovations Llc
Bought by
Robinson Tikia
Home Financials for this Owner
Home Financials are based on the most recent Mortgage that was taken out on this home.
Original Mortgage
$193,922
Interest Rate
4.5%
Mortgage Type
FHA
Purchase Details
Closed on
May 3, 2018
Sold by
Secretary Of Hud
Bought by
Marys Lane Llc and Spring Oak Renovations Llc
Purchase Details
Closed on
May 2, 2018
Sold by
Marys Lane Llc
Bought by
Spring Oak Renovations Llc
Purchase Details
Closed on
Aug 23, 2017
Sold by
Pennymac Loan Services Llc
Bought by
The Secretary Of Hud
Purchase Details
Closed on
Jun 20, 2017
Sold by
Angulo Miguel
Bought by
Pennymac Loan Services Llc
Purchase Details
Closed on
Feb 15, 2012
Sold by
Genesis 1 Llc
Bought by
Angulo Miguel A
Home Financials for this Owner
Home Financials are based on the most recent Mortgage that was taken out on this home.
Original Mortgage
$147,157
Interest Rate
3.91%
Mortgage Type
FHA
Purchase Details
Closed on
Apr 13, 2011
Sold by
U S Bank National Association
Bought by
Genesis I Llc
Home Financials for this Owner
Home Financials are based on the most recent Mortgage that was taken out on this home.
Original Mortgage
$93,000
Interest Rate
4.77%
Mortgage Type
Unknown
Purchase Details
Closed on
Jan 21, 2011
Sold by
Karras Aleeta M
Bought by
Us Bank National Association
Purchase Details
Closed on
Mar 23, 2008
Sold by
Karras Aleeta
Bought by
Williams Byron L
Purchase Details
Closed on
Aug 29, 2006
Sold by
Sherman Allan M and Sherman Elaine R
Bought by
Karras Aleeta M
Home Financials for this Owner
Home Financials are based on the most recent Mortgage that was taken out on this home.
Original Mortgage
$149,200
Interest Rate
8.5%
Mortgage Type
Unknown
Create a Home Valuation Report for This Property
The Home Valuation Report is an in-depth analysis detailing your home's value as well as a comparison with similar homes in the area
Home Values in the Area
Average Home Value in this Area
Purchase History
| Date | Buyer | Sale Price | Title Company |
|---|---|---|---|
| Onaghama Mercy | $185,000 | Citywide Title | |
| Simmons Melissa | $275,000 | Chicago Title | |
| Robinson Tikia | $197,500 | Lakeland Title Services | |
| Marys Lane Llc | -- | Lakeland Title Services | |
| Spring Oak Renovations Llc | -- | Lakeland Title Services | |
| The Secretary Of Hud | -- | None Available | |
| Pennymac Loan Services Llc | -- | None Available | |
| Angulo Miguel A | $151,500 | Fidelity National Title | |
| Genesis I Llc | $57,000 | Premier Title | |
| Us Bank National Association | -- | Premier Title | |
| Williams Byron L | -- | None Available | |
| Karras Aleeta M | $186,500 | Pntn |
Source: Public Records
Mortgage History
| Date | Status | Borrower | Loan Amount |
|---|---|---|---|
| Open | Onaghama Mercy | $175,750 | |
| Previous Owner | Simmons Melissa | $270,019 | |
| Previous Owner | Robinson Tikia | $193,922 | |
| Previous Owner | Angulo Miguel A | $147,157 | |
| Previous Owner | Genesis I Llc | $93,000 | |
| Previous Owner | Karras Aleeta M | $149,200 |
Source: Public Records
Tax History Compared to Growth
Tax History
| Year | Tax Paid | Tax Assessment Tax Assessment Total Assessment is a certain percentage of the fair market value that is determined by local assessors to be the total taxable value of land and additions on the property. | Land | Improvement |
|---|---|---|---|---|
| 2024 | $5,660 | $12,732 | $2,428 | $10,304 |
| 2023 | $4,053 | $12,732 | $2,428 | $10,304 |
| 2022 | $4,053 | $8,007 | $2,142 | $5,865 |
| 2021 | $3,865 | $8,006 | $2,142 | $5,864 |
| 2020 | $3,759 | $8,006 | $2,142 | $5,864 |
| 2019 | $6,446 | $9,471 | $1,999 | $7,472 |
| 2018 | $4,490 | $9,471 | $1,999 | $7,472 |
| 2017 | $4,360 | $9,471 | $1,999 | $7,472 |
| 2016 | $5,093 | $10,311 | $1,713 | $8,598 |
| 2015 | $4,921 | $10,311 | $1,713 | $8,598 |
| 2014 | $4,788 | $10,311 | $1,713 | $8,598 |
| 2013 | $4,194 | $8,163 | $1,713 | $6,450 |
Source: Public Records
Map
Nearby Homes
- 2722 Cherrywood Ln
- 2711 Larkspur Ln
- 2805 Knollwood Place
- 17613 Grandview Dr
- 2612 Turtle Creek Dr
- 17622 Oakwood Dr
- 17731 Larkspur Ln
- 17504 Danielle Ct
- 17714 Dogwood Ln
- 17803 Dogwood Ln
- 17805 Dogwood Ln
- 2900 175th St
- 5 E Carriageway Dr Unit 210
- 2810 Lexington Dr
- 17804 Pebblewood Ln
- 7 E Carriageway Dr Unit 311
- 2814 Lexington Dr
- 2912 175th St
- 2908 Buttonwood Walk
- 2612 175th St
- 2718 Knollwood Place
- 2802 Knollwood Place
- 2715 Cherrywood Place
- 2801 Knollwood Place
- 2804 Knollwood Place
- 2717 Cherrywood Place
- 2714 Knollwood Place
- 2801 Cherrywood Place
- 2801 Cherrywood Place
- 2719 Knollwood Place
- 2717 Knollwood Place
- 2803 Cherrywood Place
- 2806 Knollwood Place
- 2803 Knollwood Place
- 2715 Knollwood Place
- 2805 Cherrywood Place
- 2808 Knollwood Place
- 2713 Knollwood Place
- 2718 Cherrywood Place
- 2807 Knollwood Place