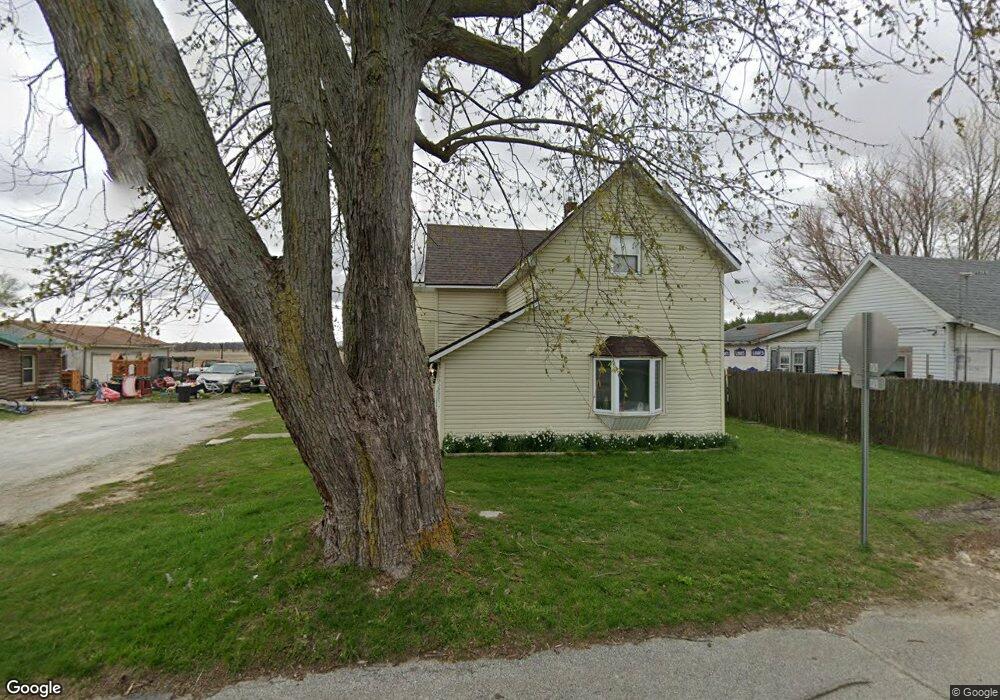
2800 N D St Elwood, IN 46036
Estimated Value: $143,593 - $157,000
3
Beds
1
Bath
1,494
Sq Ft
$101/Sq Ft
Est. Value
About This Home
This home is located at 2800 N D St, Elwood, IN 46036 and is currently estimated at $150,398, approximately $100 per square foot. 2800 N D St is a home located in Madison County with nearby schools including Elwood Elementary School, Elwood Intermediate School, and Elwood Junior-Senior High School.
Ownership History
Date
Name
Owned For
Owner Type
Purchase Details
Closed on
Apr 19, 2013
Sold by
Madison County Sheriff
Bought by
Wallace Gerald
Current Estimated Value
Purchase Details
Closed on
Jan 23, 2007
Sold by
Watson Ray
Bought by
Carter William H
Home Financials for this Owner
Home Financials are based on the most recent Mortgage that was taken out on this home.
Original Mortgage
$58,400
Interest Rate
10.55%
Mortgage Type
Adjustable Rate Mortgage/ARM
Create a Home Valuation Report for This Property
The Home Valuation Report is an in-depth analysis detailing your home's value as well as a comparison with similar homes in the area
Home Values in the Area
Average Home Value in this Area
Purchase History
| Date | Buyer | Sale Price | Title Company |
|---|---|---|---|
| Wallace Gerald | $20,000 | -- | |
| Carter William H | -- | -- |
Source: Public Records
Mortgage History
| Date | Status | Borrower | Loan Amount |
|---|---|---|---|
| Previous Owner | Carter William H | $58,400 |
Source: Public Records
Tax History Compared to Growth
Tax History
| Year | Tax Paid | Tax Assessment Tax Assessment Total Assessment is a certain percentage of the fair market value that is determined by local assessors to be the total taxable value of land and additions on the property. | Land | Improvement |
|---|---|---|---|---|
| 2024 | $1,528 | $76,400 | $6,300 | $70,100 |
| 2023 | $1,400 | $69,800 | $6,000 | $63,800 |
| 2022 | $1,404 | $69,500 | $5,700 | $63,800 |
| 2021 | $1,298 | $64,700 | $5,700 | $59,000 |
| 2020 | $1,250 | $61,800 | $5,400 | $56,400 |
| 2019 | $1,218 | $60,200 | $5,400 | $54,800 |
| 2018 | $1,144 | $56,500 | $5,400 | $51,100 |
| 2017 | $1,124 | $56,000 | $5,400 | $50,600 |
| 2016 | $1,093 | $54,100 | $5,400 | $48,700 |
| 2014 | $1,073 | $53,600 | $5,400 | $48,200 |
| 2013 | $1,073 | $53,600 | $5,400 | $48,200 |
Source: Public Records
Map
Nearby Homes