Estimated Value: $227,000 - $264,000
1
Bed
--
Bath
1,216
Sq Ft
$203/Sq Ft
Est. Value
About This Home
This home is located at 2800 N Leval Ratt Rd, Salem, IN 47167 and is currently estimated at $246,530, approximately $202 per square foot. 2800 N Leval Ratt Rd is a home located in Washington County with nearby schools including East Washington Elementary School, East Washington Middle School, and Eastern High School.
Ownership History
Date
Name
Owned For
Owner Type
Purchase Details
Closed on
Jun 14, 2021
Sold by
Girod David B and Girod David D
Bought by
Girod David D and Girod Christine F
Current Estimated Value
Home Financials for this Owner
Home Financials are based on the most recent Mortgage that was taken out on this home.
Original Mortgage
$1,165,000
Outstanding Balance
$1,054,762
Interest Rate
2.9%
Mortgage Type
New Conventional
Estimated Equity
-$808,232
Purchase Details
Closed on
Oct 26, 2018
Sold by
Mr Schwartz Johnny
Bought by
Girod David D
Home Financials for this Owner
Home Financials are based on the most recent Mortgage that was taken out on this home.
Original Mortgage
$120,000
Interest Rate
4%
Mortgage Type
Adjustable Rate Mortgage/ARM
Create a Home Valuation Report for This Property
The Home Valuation Report is an in-depth analysis detailing your home's value as well as a comparison with similar homes in the area
Home Values in the Area
Average Home Value in this Area
Purchase History
| Date | Buyer | Sale Price | Title Company |
|---|---|---|---|
| Girod David D | -- | None Listed On Document | |
| Girod David D | $150,000 | -- | |
| Girod David D | -- | None Available |
Source: Public Records
Mortgage History
| Date | Status | Borrower | Loan Amount |
|---|---|---|---|
| Open | Girod David D | $1,165,000 | |
| Previous Owner | Girod David D | $120,000 |
Source: Public Records
Tax History Compared to Growth
Tax History
| Year | Tax Paid | Tax Assessment Tax Assessment Total Assessment is a certain percentage of the fair market value that is determined by local assessors to be the total taxable value of land and additions on the property. | Land | Improvement |
|---|---|---|---|---|
| 2024 | $1,591 | $164,100 | $28,800 | $135,300 |
| 2023 | $1,569 | $158,800 | $27,300 | $131,500 |
| 2022 | $1,596 | $151,400 | $25,800 | $125,600 |
| 2021 | $1,370 | $133,300 | $25,000 | $108,300 |
| 2020 | $1,191 | $116,000 | $24,900 | $91,100 |
| 2019 | $1,069 | $108,100 | $26,000 | $82,100 |
| 2018 | $1,039 | $107,900 | $26,200 | $81,700 |
| 2017 | $990 | $110,300 | $27,100 | $83,200 |
| 2016 | $917 | $103,500 | $27,600 | $75,900 |
| 2014 | $828 | $108,200 | $27,900 | $80,300 |
| 2013 | $775 | $103,700 | $26,800 | $76,900 |
Source: Public Records
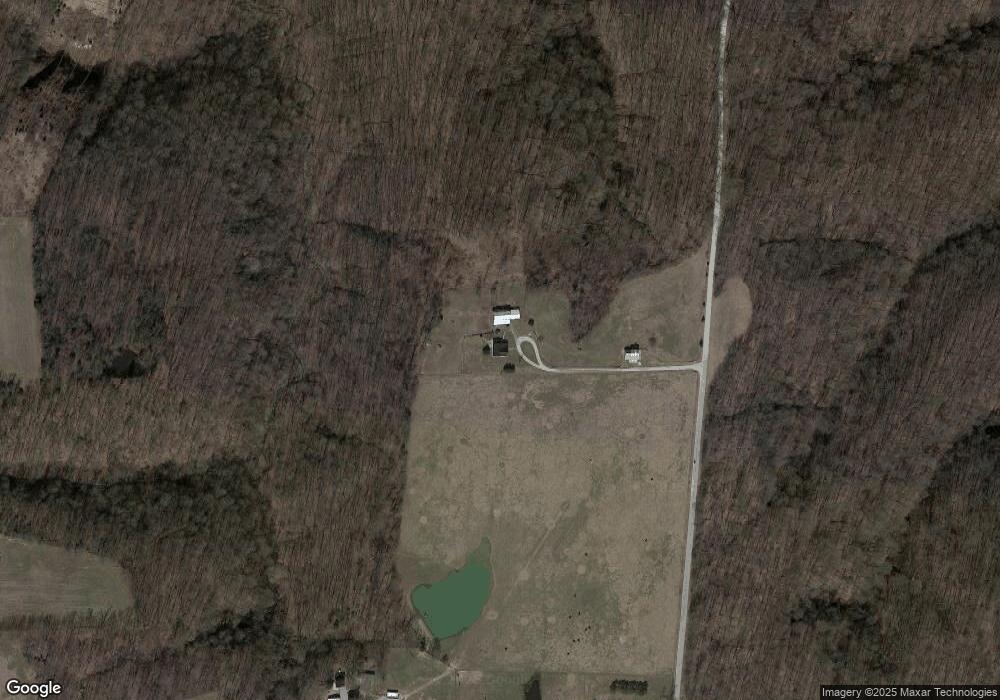
Map
Nearby Homes
- 2 N Leval Ratt Rd
- 0 North St Unit LotWP002 16975283
- E E Old 56 Unit 4
- 6430 E Old 56
- 8091 E New Philadelphia Rd
- 0 E Old State Road 56
- 2476 N Old 56
- 9781 E New Philadelphia Rd
- 3403 Lino Ln
- 10832 E Old State Road 56
- 4313 E Canton Rd
- 11213 E Old State Road 56
- 7000 S State Road 39
- 3305 E Randy Ln
- 2535 E Nathans Run
- 2506 S Mount Zion Church Rd
- 2698 S Mount Zion Church Rd
- 11015 Indiana 160
- 415 Ivan Rogers Rd
- 130 E Eastern Hills Blvd
- 2338 N Leval Ratt Rd
- 2448 N Leval Ratt Rd
- (Tract 3) N Leval Ratt Rd
- (Tract 2) N Leval Ratt Rd
- (Tract 1) N Leval Ratt Rd
- 0 N Leval Ratt Rd
- 2503 N Leval Ratt Rd
- 7107 E Old 56
- 2221 N Leval Ratt Rd
- 7109 E Old 56
- 0 North St
- off N Side N Leval Ratt Rd
- 7153 E Old 56
- 7131 E Old 56
- 7120 E Old 56
- 7098 E Old 56
- 7095 E Old 56
- 2192 N Leval Ratt Rd
- 7120 Old State 56
- 7120 Old State 56