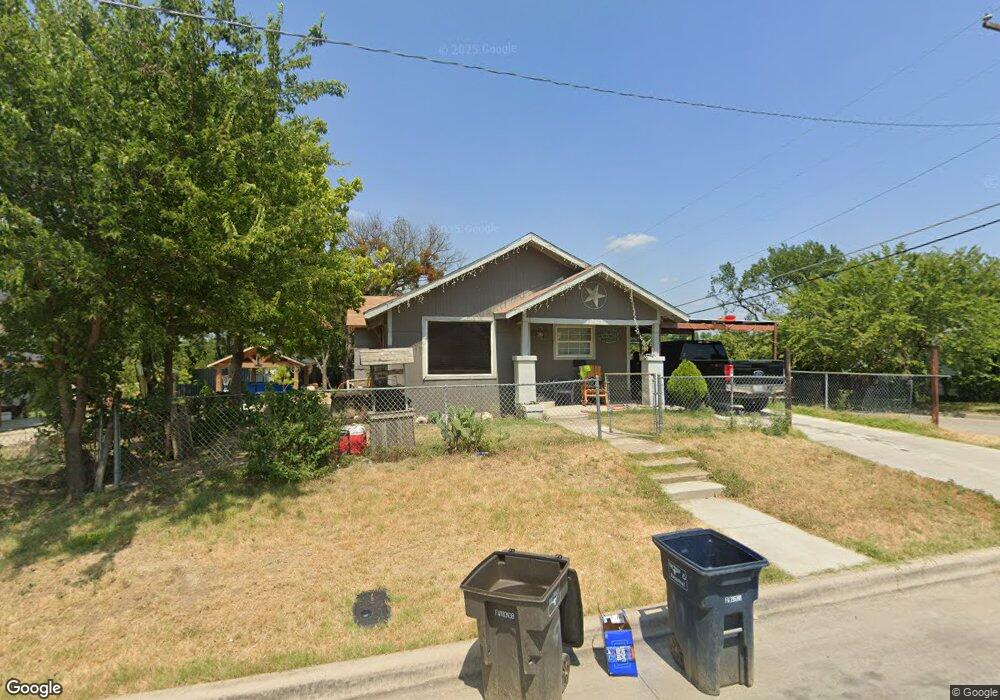
2800 NW Loraine St Fort Worth, TX 76106
Northside NeighborhoodEstimated Value: $175,000 - $209,000
2
Beds
1
Bath
884
Sq Ft
$210/Sq Ft
Est. Value
About This Home
This home is located at 2800 NW Loraine St, Fort Worth, TX 76106 and is currently estimated at $185,895, approximately $210 per square foot. 2800 NW Loraine St is a home located in Tarrant County with nearby schools including W J Turner Elementary School, Kirkpatrick Middle School, and North Side High School.
Ownership History
Date
Name
Owned For
Owner Type
Purchase Details
Closed on
Mar 12, 2012
Sold by
Shayloopa Investors Llc
Bought by
Deleon Gutierrez Jesus
Current Estimated Value
Home Financials for this Owner
Home Financials are based on the most recent Mortgage that was taken out on this home.
Original Mortgage
$32,900
Interest Rate
3.92%
Mortgage Type
Seller Take Back
Purchase Details
Closed on
Jan 6, 2009
Sold by
Perez Joel
Bought by
Npot Partners I Lp
Purchase Details
Closed on
Sep 15, 2006
Sold by
Guiterrez Martha
Bought by
Perez Joel
Home Financials for this Owner
Home Financials are based on the most recent Mortgage that was taken out on this home.
Original Mortgage
$44,500
Interest Rate
6.47%
Mortgage Type
Construction
Purchase Details
Closed on
Nov 20, 2000
Sold by
Almaguer Eusebio and Almaguer Juanita
Bought by
Guiterrez Martha
Create a Home Valuation Report for This Property
The Home Valuation Report is an in-depth analysis detailing your home's value as well as a comparison with similar homes in the area
Home Values in the Area
Average Home Value in this Area
Purchase History
| Date | Buyer | Sale Price | Title Company |
|---|---|---|---|
| Deleon Gutierrez Jesus | -- | None Available | |
| Npot Partners I Lp | $35,000 | None Available | |
| Perez Joel | -- | None Available | |
| Guiterrez Martha | -- | -- |
Source: Public Records
Mortgage History
| Date | Status | Borrower | Loan Amount |
|---|---|---|---|
| Closed | Deleon Gutierrez Jesus | $32,900 | |
| Previous Owner | Perez Joel | $44,500 |
Source: Public Records
Tax History Compared to Growth
Tax History
| Year | Tax Paid | Tax Assessment Tax Assessment Total Assessment is a certain percentage of the fair market value that is determined by local assessors to be the total taxable value of land and additions on the property. | Land | Improvement |
|---|---|---|---|---|
| 2025 | $1,659 | $134,000 | $49,000 | $85,000 |
| 2024 | $1,659 | $134,000 | $49,000 | $85,000 |
| 2023 | $3,489 | $154,191 | $35,000 | $119,191 |
| 2022 | $3,034 | $116,693 | $13,000 | $103,693 |
| 2021 | $1,783 | $65,000 | $13,000 | $52,000 |
| 2020 | $1,720 | $65,000 | $13,000 | $52,000 |
| 2019 | $1,788 | $65,000 | $13,000 | $52,000 |
| 2018 | $1,549 | $56,315 | $13,000 | $43,315 |
| 2017 | $1,470 | $51,888 | $13,000 | $38,888 |
| 2016 | $1,482 | $52,302 | $13,000 | $39,302 |
| 2015 | -- | $39,900 | $13,110 | $26,790 |
| 2014 | -- | $39,900 | $13,110 | $26,790 |
Source: Public Records
Map
Nearby Homes
- 2717 NW 27th St
- 2517 NW 29th St
- 2907 NW 26th St
- 2719 NW 25th St
- 2705 NW 34th St
- 2707 NW 24th St
- 2713 NW 35th St
- 3214 NW Loraine St
- Lot 3B Lake Prarie Trail
- 3203 NW 33rd St
- 3114 NW 23rd St
- 2814 NW 20th St
- 3009 Columbus Ave
- 2958 Columbus Ave
- 2500 NW 20th St
- 3322 NW 30th St
- 3401 NW 28th St
- 2922 Columbus Ave
- 2903 NW 18th St
- 2901 NW 18th St
- 2804 NW Loraine St
- 2724 NW Loraine St
- 2806 NW Loraine St
- 2722 NW Loraine St
- 2801 NW 29th St
- 2803 NW 29th St
- 2723 NW 29th St
- 2801 NW Loraine St
- 2808 NW Loraine St
- 2805 NW Loraine St
- 2804 Kearney Ave
- 2721 NW 29th St
- 2807 NW 29th St
- 2716 NW Loraine St
- 2807 NW Loraine St
- 2721 NW Loraine St
- 2810 NW Loraine St
- 2809 NW 29th St
- 2719 NW 29th St
- 2809 NW Loraine St