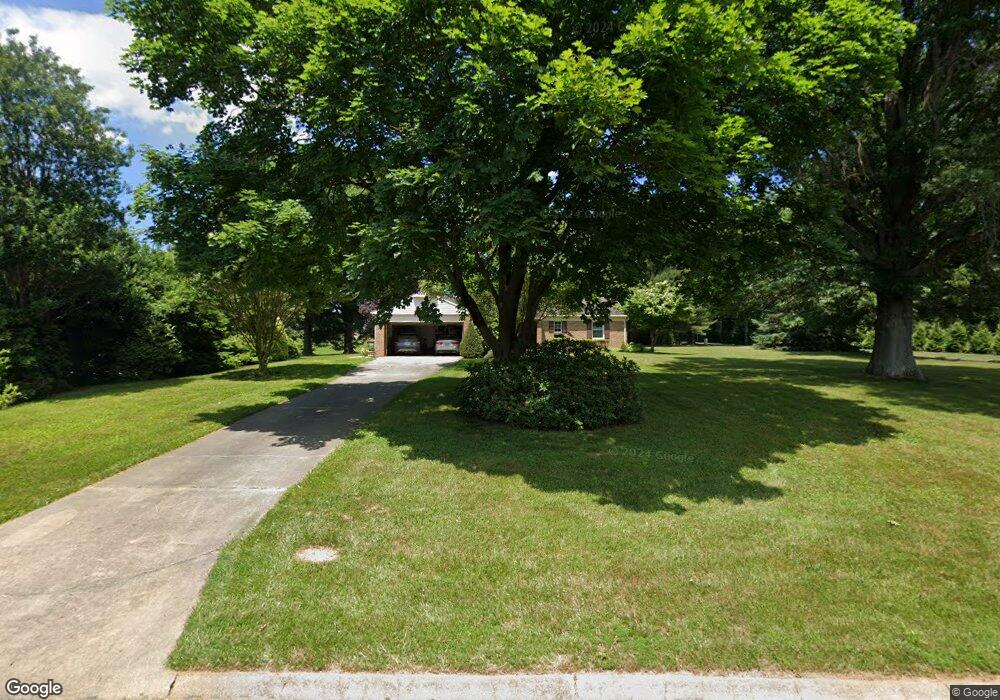
2800 Shady Grove Ct Baldwin, MD 21013
Estimated Value: $478,000 - $688,000
--
Bed
2
Baths
1,442
Sq Ft
$374/Sq Ft
Est. Value
About This Home
This home is located at 2800 Shady Grove Ct, Baldwin, MD 21013 and is currently estimated at $539,169, approximately $373 per square foot. 2800 Shady Grove Ct is a home located in Harford County with nearby schools including Youths Benefit Elementary School, Fallston Middle School, and Fallston High School.
Ownership History
Date
Name
Owned For
Owner Type
Purchase Details
Closed on
Apr 1, 2004
Sold by
Carroll Mark S
Bought by
Smith Jeffrey H and Smith Angela M
Current Estimated Value
Purchase Details
Closed on
Mar 19, 2004
Sold by
Carroll Mark S
Bought by
Smith Jeffrey H and Smith Angela M
Purchase Details
Closed on
Nov 10, 1994
Sold by
Sheehan Kirk P
Bought by
Carroll Mark S
Home Financials for this Owner
Home Financials are based on the most recent Mortgage that was taken out on this home.
Original Mortgage
$175,750
Interest Rate
8.78%
Purchase Details
Closed on
May 3, 1990
Sold by
Lipps Harry W
Bought by
Sheehan Kirk P
Home Financials for this Owner
Home Financials are based on the most recent Mortgage that was taken out on this home.
Original Mortgage
$151,954
Interest Rate
10.56%
Create a Home Valuation Report for This Property
The Home Valuation Report is an in-depth analysis detailing your home's value as well as a comparison with similar homes in the area
Home Values in the Area
Average Home Value in this Area
Purchase History
| Date | Buyer | Sale Price | Title Company |
|---|---|---|---|
| Smith Jeffrey H | $339,000 | -- | |
| Smith Jeffrey H | $339,000 | -- | |
| Carroll Mark S | $185,000 | -- | |
| Sheehan Kirk P | $164,000 | -- |
Source: Public Records
Mortgage History
| Date | Status | Borrower | Loan Amount |
|---|---|---|---|
| Previous Owner | Carroll Mark S | $175,750 | |
| Previous Owner | Sheehan Kirk P | $151,954 | |
| Closed | Smith Jeffrey H | -- |
Source: Public Records
Tax History Compared to Growth
Tax History
| Year | Tax Paid | Tax Assessment Tax Assessment Total Assessment is a certain percentage of the fair market value that is determined by local assessors to be the total taxable value of land and additions on the property. | Land | Improvement |
|---|---|---|---|---|
| 2025 | $3,469 | $329,700 | $0 | $0 |
| 2024 | $3,409 | $312,800 | $128,100 | $184,700 |
| 2023 | $3,345 | $306,933 | $0 | $0 |
| 2022 | $3,341 | $301,067 | $0 | $0 |
| 2021 | $3,412 | $295,200 | $128,100 | $167,100 |
| 2020 | $3,412 | $290,467 | $0 | $0 |
| 2019 | $3,357 | $285,733 | $0 | $0 |
| 2018 | $3,273 | $281,000 | $138,100 | $142,900 |
| 2017 | $3,270 | $281,000 | $0 | $0 |
| 2016 | -- | $280,467 | $0 | $0 |
| 2015 | $3,497 | $280,200 | $0 | $0 |
| 2014 | $3,497 | $280,200 | $0 | $0 |
Source: Public Records
Map
Nearby Homes
- 2710 Hunting Ridge Ct
- 2310 Kings Arms Dr
- 2431 Baldwin Mill Rd
- 3311 Pritchett Ln
- 2301 Victorian View Ct
- 2258 Baldwin Mill Rd
- 2922 Charles St
- 4200 Hedgehill Ln
- 2326 Willow Vale Dr
- 22 Farm Ridge Ct
- 13829 Manor Glen Rd
- 2304 Furnace Rd
- 1913 Trout Farm Rd
- 4718 Carroll Manor Rd
- 4718 Carroll Manor Rd
- 4718 Carroll Manor Rd
- 4718 Carroll Manor Rd
- 4726 Carroll Manor Rd
- 4712 Carroll Manor Rd
- Lot 3 Carroll Manor Rd
- 2802 Shady Grove Ct
- 2710 Shady Grove Dr
- 3015 Moores Rd
- 2804 Shady Grove Ct
- 2803 Blythe Ct
- 2801 Shady Grove Ct
- 3016 Moores Rd
- 2805 Blythe Ct
- 2803 Shady Grove Ct
- 3009 Moores Rd
- 2806 Shady Grove Ct
- 2759 Greene Ln
- 3003 Moores Rd
- 2807 Blythe Ct
- 3005 Moores Rd
- 3101 Moores Rd
- 2805 Shady Grove Ct
- 2807 Shady Grove Ct
- 2804 Blythe Ct
- 3100 Moores Rd