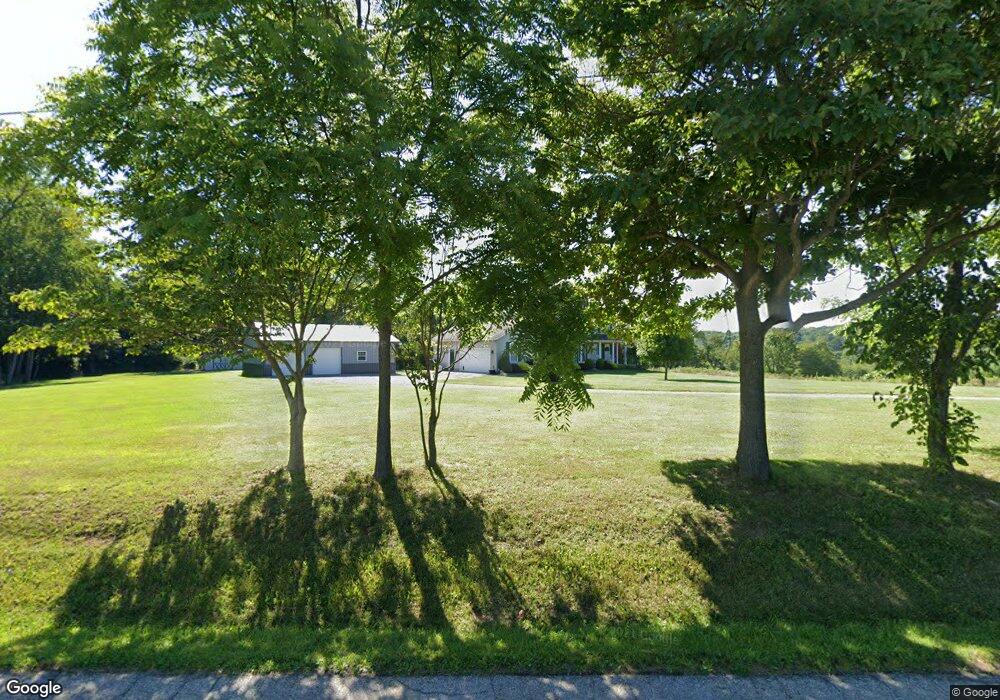
2800 W Point Rd SE Lancaster, OH 43130
Estimated Value: $357,000 - $526,669
3
Beds
3
Baths
2,200
Sq Ft
$212/Sq Ft
Est. Value
About This Home
This home is located at 2800 W Point Rd SE, Lancaster, OH 43130 and is currently estimated at $465,667, approximately $211 per square foot. 2800 W Point Rd SE is a home located in Fairfield County with nearby schools including Bremen Elementary School and Fairfield Union High School.
Ownership History
Date
Name
Owned For
Owner Type
Purchase Details
Closed on
Jul 2, 2014
Sold by
Oliver Steven R and Oliver Rhonda K
Bought by
Wells Christopher J and Wells Briget R
Current Estimated Value
Home Financials for this Owner
Home Financials are based on the most recent Mortgage that was taken out on this home.
Original Mortgage
$204,800
Outstanding Balance
$155,821
Interest Rate
4.13%
Mortgage Type
New Conventional
Estimated Equity
$309,846
Purchase Details
Closed on
May 27, 2005
Sold by
Lanning Rusty A and Lanning Robyn E
Bought by
Oliver Steven R and Oliver Rhonda K
Home Financials for this Owner
Home Financials are based on the most recent Mortgage that was taken out on this home.
Original Mortgage
$192,000
Interest Rate
6.07%
Mortgage Type
Fannie Mae Freddie Mac
Purchase Details
Closed on
Aug 31, 2001
Sold by
Harris John N
Bought by
Lanning Rusty A and Lanning Robyn E
Home Financials for this Owner
Home Financials are based on the most recent Mortgage that was taken out on this home.
Original Mortgage
$32,637
Interest Rate
7.11%
Mortgage Type
New Conventional
Create a Home Valuation Report for This Property
The Home Valuation Report is an in-depth analysis detailing your home's value as well as a comparison with similar homes in the area
Home Values in the Area
Average Home Value in this Area
Purchase History
| Date | Buyer | Sale Price | Title Company |
|---|---|---|---|
| Wells Christopher J | $256,000 | Valmer Land Title Agency Box | |
| Oliver Steven R | $240,000 | -- | |
| Lanning Rusty A | $35,500 | -- |
Source: Public Records
Mortgage History
| Date | Status | Borrower | Loan Amount |
|---|---|---|---|
| Open | Wells Christopher J | $204,800 | |
| Closed | Oliver Steven R | $192,000 | |
| Closed | Lanning Rusty A | $32,637 |
Source: Public Records
Tax History Compared to Growth
Tax History
| Year | Tax Paid | Tax Assessment Tax Assessment Total Assessment is a certain percentage of the fair market value that is determined by local assessors to be the total taxable value of land and additions on the property. | Land | Improvement |
|---|---|---|---|---|
| 2024 | $10,090 | $132,150 | $15,660 | $116,490 |
| 2023 | $5,165 | $132,150 | $15,660 | $116,490 |
| 2022 | $5,167 | $132,150 | $15,660 | $116,490 |
| 2021 | $4,387 | $102,760 | $14,920 | $87,840 |
| 2020 | $4,017 | $97,860 | $14,920 | $82,940 |
| 2019 | $3,855 | $94,090 | $14,920 | $79,170 |
| 2018 | $3,540 | $83,750 | $14,920 | $68,830 |
| 2017 | $3,540 | $83,750 | $14,920 | $68,830 |
| 2016 | $3,489 | $83,750 | $14,920 | $68,830 |
| 2015 | $3,413 | $80,610 | $14,920 | $65,690 |
| 2014 | $3,266 | $80,610 | $14,920 | $65,690 |
| 2013 | $3,266 | $80,610 | $14,920 | $65,690 |
Source: Public Records
Map
Nearby Homes
- 6701 Pleasantview Rd SE
- 2091 Bearclaw Ct
- 1893 Beaver Ln
- 2145 W Point Rd SE
- 5440 Borah Hill Rd
- 1275 Taos Ln
- 1201 Taos Ln
- 0 Paradise Rd Unit 225035600
- 7791 Pleasantview Rd SE
- 657 Natchez Ln
- 1160 Flathead Ln
- 670 Natchez Ln
- 317 Winnebago Ln
- 295 Tillamook Ln
- 298 Tillamook Ln
- 144 Hide-A-way Rd
- 93 Aztec Ln
- 324 Winnebago Ln
- 849 Papago Ln
- 1060 Fox Ln
- 2800 W Point Rd SE
- 2848 W Point Rd SE
- 2805 W Point Rd SE
- 2720 West Point Rd
- 2755 W Point Rd SE
- 2755 W Point Rd SE
- 6595 Pleasantview Rd SE
- 2871 W Point Rd SE
- 2871 W Point Rd SE
- 6597 Pleasantview Rd SE
- 2900 West Point Rd
- 6520 Pleasantview Rd SE
- 6615 Pleasantview Rd SE
- 6620 Pleasantview Rd SE
- 2690 West Point Rd
- 2945 W Point Rd SE
- 2980 W Point Rd SE
- 2980 W Point Rd SE
- 6500 Pleasantview Rd SE
- 6645 Pleasantview Rd SE