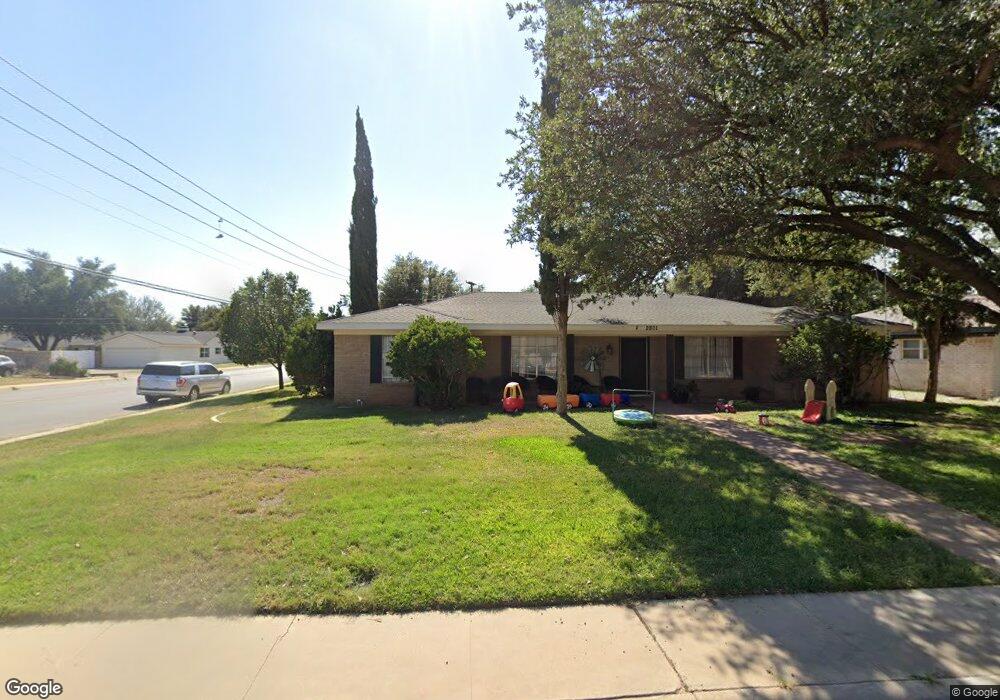
2801 Auburn Dr Midland, TX 79705
Estimated Value: $390,000 - $436,000
--
Bed
2
Baths
2,702
Sq Ft
$154/Sq Ft
Est. Value
About This Home
This home is located at 2801 Auburn Dr, Midland, TX 79705 and is currently estimated at $416,695, approximately $154 per square foot. 2801 Auburn Dr is a home located in Midland County with nearby schools including Midland High School, Robert H. Goddard Junior High School, and Midland Christian School.
Ownership History
Date
Name
Owned For
Owner Type
Purchase Details
Closed on
May 27, 2025
Sold by
Samples Steven and Samples Suni
Bought by
Lone Star Cash Homes Llc
Current Estimated Value
Home Financials for this Owner
Home Financials are based on the most recent Mortgage that was taken out on this home.
Original Mortgage
$329,700
Outstanding Balance
$195,048
Interest Rate
6.83%
Mortgage Type
Construction
Estimated Equity
$221,647
Purchase Details
Closed on
Dec 3, 2010
Sold by
Franz Fayette Leland
Bought by
Samples Steve and Samples Suni
Home Financials for this Owner
Home Financials are based on the most recent Mortgage that was taken out on this home.
Original Mortgage
$176,411
Interest Rate
4.22%
Mortgage Type
FHA
Purchase Details
Closed on
Nov 7, 1974
Bought by
Samples Steve
Create a Home Valuation Report for This Property
The Home Valuation Report is an in-depth analysis detailing your home's value as well as a comparison with similar homes in the area
Home Values in the Area
Average Home Value in this Area
Purchase History
| Date | Buyer | Sale Price | Title Company |
|---|---|---|---|
| Lone Star Cash Homes Llc | -- | Lone Star Abstract & Title | |
| Samples Steve | -- | West Texas Abstract & Title | |
| Samples Steve | -- | -- |
Source: Public Records
Mortgage History
| Date | Status | Borrower | Loan Amount |
|---|---|---|---|
| Open | Lone Star Cash Homes Llc | $329,700 | |
| Previous Owner | Samples Steve | $176,411 |
Source: Public Records
Tax History Compared to Growth
Tax History
| Year | Tax Paid | Tax Assessment Tax Assessment Total Assessment is a certain percentage of the fair market value that is determined by local assessors to be the total taxable value of land and additions on the property. | Land | Improvement |
|---|---|---|---|---|
| 2025 | $4,411 | $316,910 | $30,150 | $286,760 |
| 2024 | $4,417 | $290,860 | $30,150 | $260,710 |
| 2023 | $4,250 | $283,570 | $30,150 | $253,420 |
| 2022 | $4,645 | $297,310 | $30,150 | $267,160 |
| 2021 | $4,991 | $286,480 | $30,150 | $256,330 |
| 2020 | $4,940 | $289,520 | $30,150 | $259,370 |
| 2019 | $5,481 | $289,520 | $30,150 | $259,370 |
| 2018 | $4,888 | $251,400 | $30,150 | $221,250 |
| 2017 | $4,624 | $237,820 | $30,150 | $207,670 |
| 2016 | $4,626 | $237,500 | $30,150 | $207,350 |
| 2015 | -- | $237,500 | $30,150 | $207,350 |
| 2014 | -- | $235,030 | $30,150 | $204,880 |
Source: Public Records
Map
Nearby Homes
- 2806 Auburn Dr
- 2400 Metz Ct
- 2613 Haynes Dr
- 5 Chatham Ct
- 2817 Maxwell Dr
- 2505 Maxwell Dr
- 2811 Durant Dr
- 2409 Stutz Place
- 2406 Stutz Place
- 63 Ironwood Ct Unit 91
- 63 Ironwood Ct
- 3105 Auburn Dr
- 3203 Maxwell Dr
- 4 Amhurst Ct
- 2605 Inwood Ct
- 3205 Maxwell Dr
- 2406 Dartmouth Dr
- 3200 Durant Dr
- 3207 Marmon Dr
- 2604 Emerson Dr