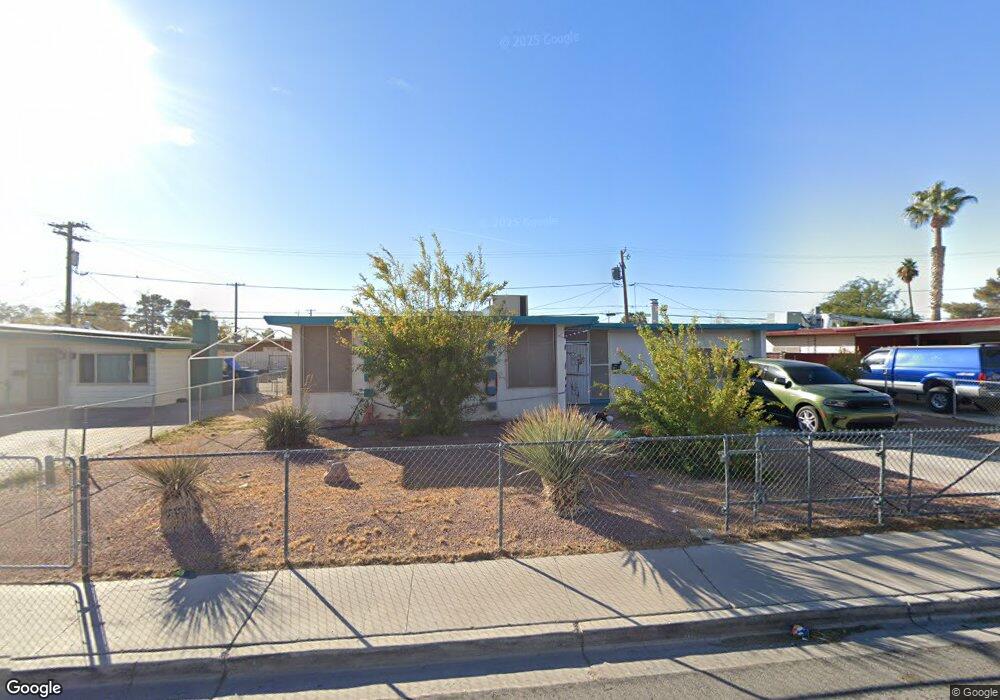
2801 E Tonopah Ave North Las Vegas, NV 89030
Downtown North Las Vegas NeighborhoodEstimated Value: $317,000 - $343,000
3
Beds
2
Baths
1,368
Sq Ft
$241/Sq Ft
Est. Value
About This Home
This home is located at 2801 E Tonopah Ave, North Las Vegas, NV 89030 and is currently estimated at $329,546, approximately $240 per square foot. 2801 E Tonopah Ave is a home located in Clark County with nearby schools including Tom Williams Elementary School, J.D. Smith Middle School, and Rancho High School.
Ownership History
Date
Name
Owned For
Owner Type
Purchase Details
Closed on
Aug 15, 2024
Sold by
Dearing Ricky K
Bought by
Jordan Daniel Mahi
Current Estimated Value
Home Financials for this Owner
Home Financials are based on the most recent Mortgage that was taken out on this home.
Original Mortgage
$163,105
Outstanding Balance
$161,287
Interest Rate
6.95%
Mortgage Type
FHA
Estimated Equity
$168,259
Purchase Details
Closed on
Apr 22, 2016
Sold by
Dearing Hattie A
Bought by
Dearing Ricky A
Purchase Details
Closed on
Jun 4, 2007
Sold by
Dearing Hattie A
Bought by
Dearing Hattie A and The Alva E & Hattie A Dearing Revocable
Purchase Details
Closed on
Oct 16, 2006
Sold by
Dearing Hattie A
Bought by
Dearing Hattie A
Purchase Details
Closed on
Jan 28, 2002
Sold by
Dearing Alva E and Dearing Hattie A
Bought by
Dearing Alva E and Dearing Hattie A
Create a Home Valuation Report for This Property
The Home Valuation Report is an in-depth analysis detailing your home's value as well as a comparison with similar homes in the area
Home Values in the Area
Average Home Value in this Area
Purchase History
| Date | Buyer | Sale Price | Title Company |
|---|---|---|---|
| Jordan Daniel Mahi | $318,300 | Old Republic Title | |
| Dearing Ricky K | -- | Old Republic Title | |
| Dearing Ricky A | -- | None Available | |
| Dearing Ricky K | $58,514 | None Available | |
| Dearing Hattie A | -- | None Available | |
| Dearing Hattie A | -- | None Available | |
| Dearing Alva E | -- | -- |
Source: Public Records
Mortgage History
| Date | Status | Borrower | Loan Amount |
|---|---|---|---|
| Open | Jordan Daniel Mahi | $163,105 |
Source: Public Records
Tax History Compared to Growth
Tax History
| Year | Tax Paid | Tax Assessment Tax Assessment Total Assessment is a certain percentage of the fair market value that is determined by local assessors to be the total taxable value of land and additions on the property. | Land | Improvement |
|---|---|---|---|---|
| 2025 | $705 | $43,206 | $24,150 | $19,056 |
| 2024 | $653 | $43,206 | $24,150 | $19,056 |
| 2023 | $653 | $42,788 | $25,900 | $16,888 |
| 2022 | $605 | $36,870 | $21,700 | $15,170 |
| 2021 | $561 | $34,458 | $20,300 | $14,158 |
| 2020 | $518 | $33,025 | $19,250 | $13,775 |
| 2019 | $485 | $29,057 | $15,750 | $13,307 |
| 2018 | $463 | $25,113 | $12,600 | $12,513 |
| 2017 | $768 | $22,900 | $10,500 | $12,400 |
| 2016 | $435 | $19,070 | $7,000 | $12,070 |
| 2015 | $390 | $17,318 | $5,600 | $11,718 |
| 2014 | $378 | $14,790 | $4,200 | $10,590 |
Source: Public Records
Map
Nearby Homes
- 1311 Flower Ave
- 2801 Emmons Ave
- 2844 Hickey Ave
- 2746 E Owens Ave
- 2613 Hickey Ave
- 1904 Gifford St
- 0 E Reynolds Ave
- 3200 E Owens Ave
- 2315 Perliter Ave
- 1628 Palmer St
- 1413 N Mojave Rd
- 3308 E Lake Mead Blvd
- 1620 Kenneth St
- 1304 Melissa St
- 2105 Stanley Ave
- 3600 Reynolds Ave
- 3308 Tabor Ave
- 1226 Coach Ln
- 3104 Dillon Ave
- 3601 E Webb Ave
- 2807 E Tonopah Ave
- 2743 E Tonopah Ave
- 2800 Taylor Ave
- 2742 Taylor Ave
- 2806 Taylor Ave
- 2813 E Tonopah Ave
- 2737 E Tonopah Ave
- 2800 E Tonopah Ave
- 2806 E Tonopah Ave
- 2812 Taylor Ave
- 2742 E Tonopah Ave
- 2819 E Tonopah Ave
- 2731 E Tonopah Ave
- 2812 E Tonopah Ave
- 2736 E Tonopah Ave
- 2730 Taylor Ave
- 2730 Taylor Ave
- 2818 Taylor Ave
- 2818 E Tonopah Ave
- 2801 Perliter Ave