Estimated Value: $364,000 - $385,000
4
Beds
2
Baths
2,156
Sq Ft
$173/Sq Ft
Est. Value
About This Home
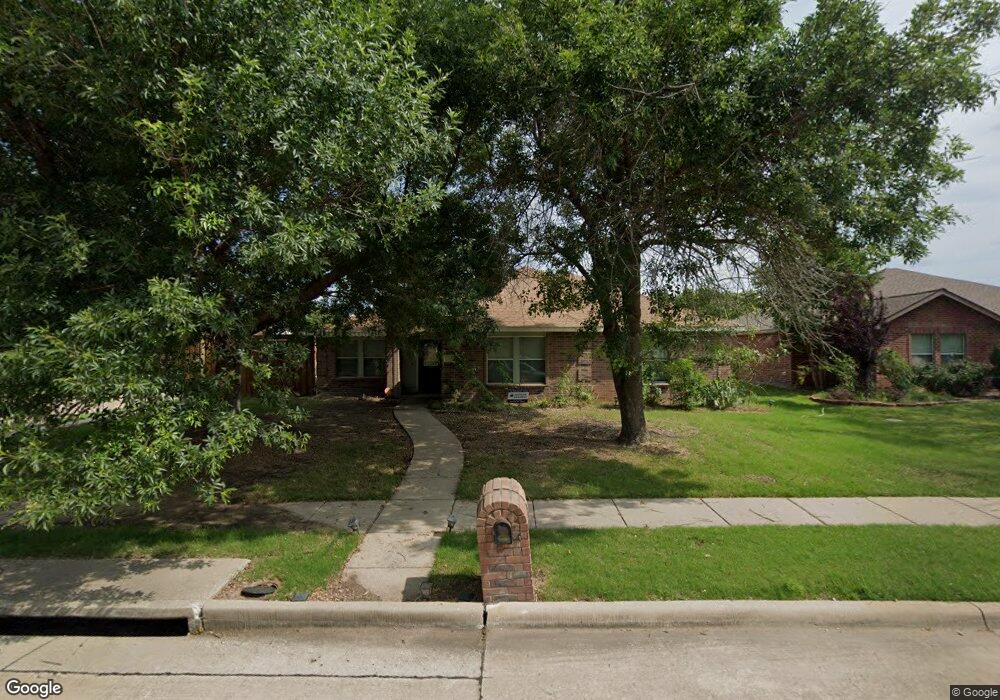
This home is located at 2801 Kernville Dr, Wylie, TX 75098 and is currently estimated at $371,913, approximately $172 per square foot. 2801 Kernville Dr is a home located in Collin County with nearby schools including P M Akin Elementary School, AB Harrison Intermediate School, and Grady Burnett J High School.
Ownership History
Date
Name
Owned For
Owner Type
Purchase Details
Closed on
Feb 14, 2012
Sold by
Red Deanna J
Bought by
Red James O
Current Estimated Value
Purchase Details
Closed on
May 28, 2008
Sold by
Mccain Travis E
Bought by
Red James O and Red Deanna J
Home Financials for this Owner
Home Financials are based on the most recent Mortgage that was taken out on this home.
Original Mortgage
$162,450
Outstanding Balance
$104,350
Interest Rate
6.07%
Mortgage Type
Purchase Money Mortgage
Estimated Equity
$267,563
Purchase Details
Closed on
Mar 17, 2003
Sold by
Centex Homes
Bought by
Mccain Travis E and Mccain April L
Home Financials for this Owner
Home Financials are based on the most recent Mortgage that was taken out on this home.
Original Mortgage
$133,878
Interest Rate
5.77%
Mortgage Type
FHA
Create a Home Valuation Report for This Property
The Home Valuation Report is an in-depth analysis detailing your home's value as well as a comparison with similar homes in the area
Home Values in the Area
Average Home Value in this Area
Purchase History
| Date | Buyer | Sale Price | Title Company |
|---|---|---|---|
| Red James O | -- | None Available | |
| Red James O | -- | Hftc | |
| Mccain Travis E | -- | -- |
Source: Public Records
Mortgage History
| Date | Status | Borrower | Loan Amount |
|---|---|---|---|
| Open | Red James O | $162,450 | |
| Previous Owner | Mccain Travis E | $133,878 |
Source: Public Records
Tax History Compared to Growth
Tax History
| Year | Tax Paid | Tax Assessment Tax Assessment Total Assessment is a certain percentage of the fair market value that is determined by local assessors to be the total taxable value of land and additions on the property. | Land | Improvement |
|---|---|---|---|---|
| 2025 | $7,640 | $380,846 | $94,500 | $286,346 |
| 2024 | $7,640 | $386,811 | $94,500 | $292,311 |
| 2023 | $7,640 | $363,710 | $99,750 | $263,960 |
| 2022 | $7,500 | $341,859 | $78,750 | $263,109 |
| 2021 | $6,459 | $274,509 | $57,750 | $216,759 |
| 2020 | $6,528 | $262,906 | $57,750 | $205,156 |
| 2019 | $6,766 | $257,476 | $57,750 | $199,726 |
| 2018 | $6,961 | $258,464 | $52,500 | $205,964 |
| 2017 | $6,037 | $224,166 | $47,250 | $176,916 |
| 2016 | $5,593 | $201,301 | $36,750 | $164,551 |
| 2015 | $4,755 | $189,846 | $36,750 | $153,096 |
Source: Public Records
Map
Nearby Homes
- 2800 Gold Hill Dr
- 209 Duck Blind Ave
- 2801-3 N State Highway 78
- 2801-1 N State Highway 78
- 211 Rutherford Ave
- 2601 Waverly Dr
- 2603 Waverly Dr
- 1312 Wyndham Dr
- 2605 Waverly Dr
- 2607 Waverly Dr
- 2606 Waverly Dr
- 1308 London Dr
- 2608 Waverly Dr
- 2601 Ackley Ln
- 2603 Ackley Ln
- Santa Fe Plan at Kreymer at the Park
- Omaha Plan at Kreymer at the Park
- Glasgow Plan at Kreymer at the Park
- Mykonos Plan at Kreymer at the Park
- Malmo Plan at Kreymer at the Park
- 2803 Kernville Dr
- 2717 Kernville Dr
- 2805 Kernville Dr
- 2800 Sutters Mill Way
- 2802 Sutters Mill Way
- 2802 Kernville Dr
- 2800 Kernville Dr
- 2804 Kernville Dr
- 2715 Kernville Dr
- 2716 Sutters Mill Way
- 2807 Kernville Dr
- 2804 Sutters Mill Way
- 2716 Kernville Dr
- 2714 Sutters Mill Way
- 2806 Sutters Mill Way
- 2806 Sutters Mill Way
- 2713 Kernville Dr
- 2714 Kernville Dr
- 2809 Kernville Dr
- 2808 Kernville Dr