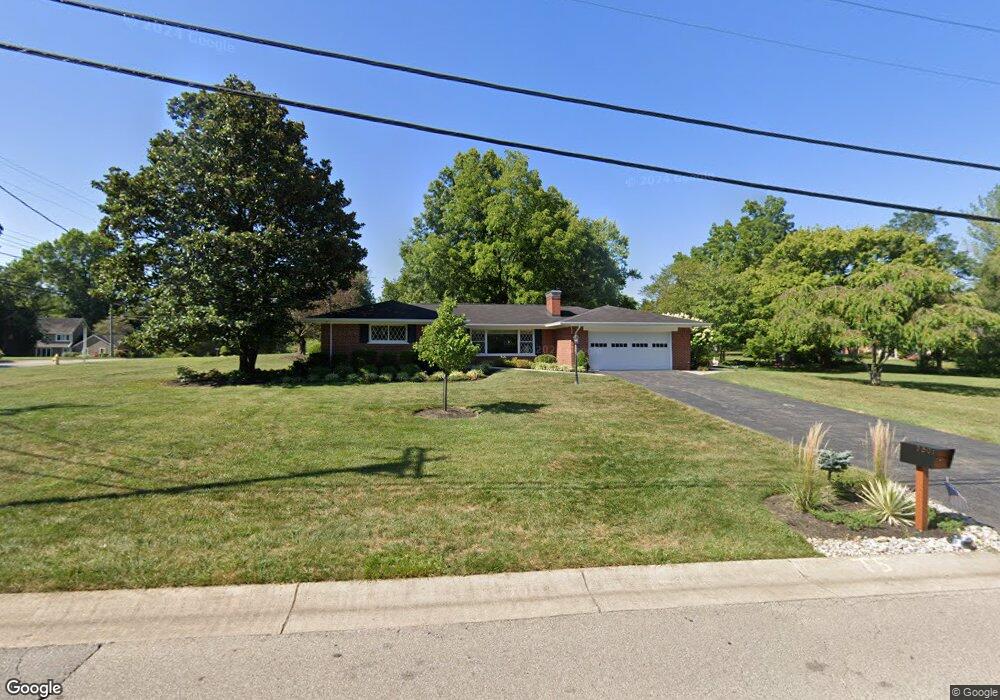
2801 Lengel Rd Cincinnati, OH 45244
Turpin Hills NeighborhoodEstimated Value: $465,769 - $505,000
3
Beds
3
Baths
1,856
Sq Ft
$262/Sq Ft
Est. Value
About This Home
This home is located at 2801 Lengel Rd, Cincinnati, OH 45244 and is currently estimated at $486,442, approximately $262 per square foot. 2801 Lengel Rd is a home located in Hamilton County with nearby schools including Mercer Elementary School, Nagel Middle School, and Turpin High School.
Ownership History
Date
Name
Owned For
Owner Type
Purchase Details
Closed on
Mar 11, 2021
Sold by
Melrose Properties Llc
Bought by
Foster Sandra Lee
Current Estimated Value
Home Financials for this Owner
Home Financials are based on the most recent Mortgage that was taken out on this home.
Original Mortgage
$346,500
Outstanding Balance
$307,777
Interest Rate
2.7%
Mortgage Type
New Conventional
Estimated Equity
$178,665
Purchase Details
Closed on
Jul 8, 2020
Sold by
Donnellan Mary Kathleen
Bought by
Melrose Properties Llc
Purchase Details
Closed on
Nov 26, 2003
Sold by
Oppenheimer Timothy
Bought by
Donnellan Mary K
Home Financials for this Owner
Home Financials are based on the most recent Mortgage that was taken out on this home.
Original Mortgage
$168,000
Interest Rate
6.01%
Mortgage Type
Unknown
Create a Home Valuation Report for This Property
The Home Valuation Report is an in-depth analysis detailing your home's value as well as a comparison with similar homes in the area
Home Values in the Area
Average Home Value in this Area
Purchase History
| Date | Buyer | Sale Price | Title Company |
|---|---|---|---|
| Foster Sandra Lee | $385,000 | Premier Service Ttl Agcy Llc | |
| Melrose Properties Llc | $176,500 | None Available | |
| Donnellan Mary K | -- | -- |
Source: Public Records
Mortgage History
| Date | Status | Borrower | Loan Amount |
|---|---|---|---|
| Open | Foster Sandra Lee | $346,500 | |
| Previous Owner | Donnellan Mary K | $168,000 |
Source: Public Records
Tax History
| Year | Tax Paid | Tax Assessment Tax Assessment Total Assessment is a certain percentage of the fair market value that is determined by local assessors to be the total taxable value of land and additions on the property. | Land | Improvement |
|---|---|---|---|---|
| 2025 | $8,424 | $134,751 | $28,123 | $106,628 |
| 2023 | $7,787 | $134,751 | $28,123 | $106,628 |
| 2022 | $8,741 | $134,750 | $24,500 | $110,250 |
| 2021 | $3,921 | $61,775 | $24,500 | $37,275 |
| 2020 | $5,870 | $91,557 | $24,500 | $67,057 |
| 2019 | $5,722 | $81,026 | $21,683 | $59,343 |
| 2018 | $5,360 | $81,026 | $21,683 | $59,343 |
| 2017 | $5,055 | $81,026 | $21,683 | $59,343 |
| 2016 | $4,924 | $77,102 | $21,609 | $55,493 |
| 2015 | $4,782 | $77,102 | $21,609 | $55,493 |
| 2014 | $4,785 | $77,102 | $21,609 | $55,493 |
| 2013 | $4,311 | $73,430 | $20,580 | $52,850 |
Source: Public Records
Map
Nearby Homes
- 2631 Newtown Rd
- 2412 Findlater Ct
- 6542 Rainbow Ln
- 6716 Treeridge Dr
- 6253 Sturdy Ave
- 6939 Treeridge Dr
- 2133 Ronaldson Ave
- 6809 Jefferson St
- 6122 Corbly Rd
- 2140 Trailwood Dr
- 6912 Edith St
- 1486 Meadowbright Ln
- 2111 Sutton Ave
- 6050 Bagdad Dr
- 1944 Rockland Ave
- 7080 Hunley Rd
- 1229 Meadowbright Ln
- 6050 Colter Ave
- 3305 Scioto Dr
- 5965 Wayside Ave
- 5952 Turpin Hills Dr
- 2800 Lengel Rd
- 2825 Lengel Rd
- 5938 Turpin Hills Dr
- 5967 Crittenden Dr
- 5959 Turpin Hills Dr
- 2824 Lengel Rd
- 5994 Turpin Hills Dr
- 5977 Turpin Hills Dr
- 5940 Turpin Valley Ln
- 5924 Turpin Hills Dr
- 5987 Crittenden Dr
- 6008 Turpin Hills Dr
- 5993 Turpin Hills Dr
- 5935 Turpin Valley Ln
- 5953 Crittenden Dr
- 5993 Crittenden Dr
- 5910 Turpin Hills Dr
- 2812 Crittwoods Ct
- 6013 Turpin Hills Dr
Your Personal Tour Guide
Ask me questions while you tour the home.