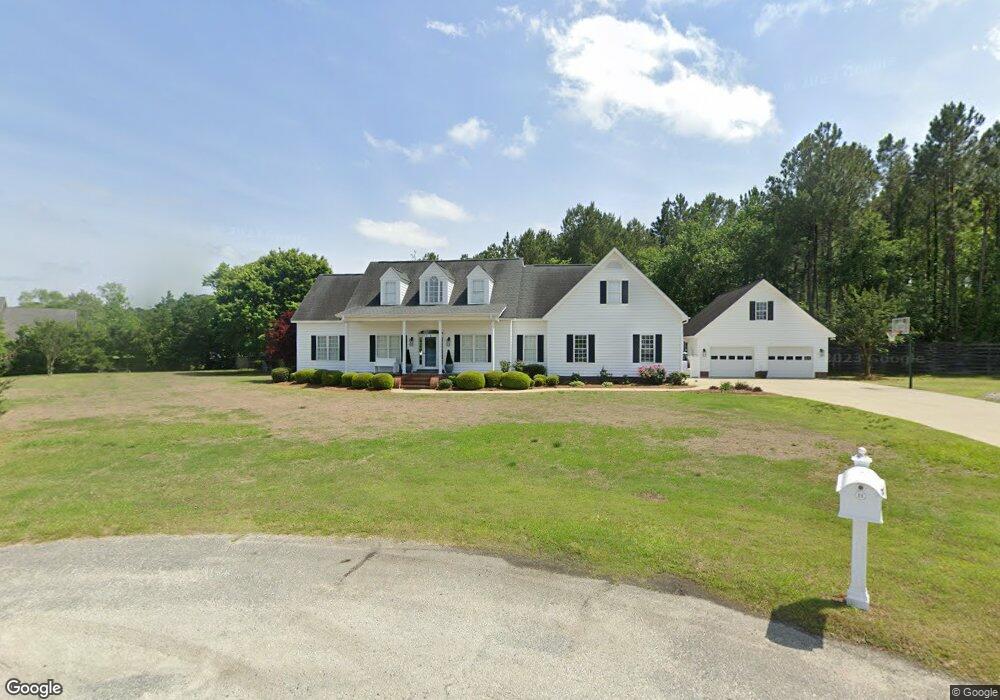
2801 Nautica Place Kinston, NC 28504
Estimated Value: $352,000 - $470,000
3
Beds
3
Baths
2,860
Sq Ft
$144/Sq Ft
Est. Value
About This Home
This home is located at 2801 Nautica Place, Kinston, NC 28504 and is currently estimated at $411,602, approximately $143 per square foot. 2801 Nautica Place is a home located in Lenoir County with nearby schools including Banks Elementary School, E.B. Frink Middle School, and North Lenoir High School.
Ownership History
Date
Name
Owned For
Owner Type
Purchase Details
Closed on
Aug 20, 2021
Sold by
Baker Patricia Smith and Baker Gene Stewart
Bought by
Harrison Jamie Smith and Harrison Corey Douglas
Current Estimated Value
Home Financials for this Owner
Home Financials are based on the most recent Mortgage that was taken out on this home.
Original Mortgage
$240,000
Outstanding Balance
$217,906
Interest Rate
2.8%
Mortgage Type
New Conventional
Estimated Equity
$193,696
Purchase Details
Closed on
Dec 5, 2019
Sold by
Baker Patricia S
Bought by
Baker Patricia S and Harrison Jamie S
Purchase Details
Closed on
Mar 28, 2019
Sold by
Baker Gene S
Bought by
Smith-Baker Patrici
Purchase Details
Closed on
Sep 24, 2009
Sold by
Baker Patricia Smith and Smith Patricia L
Bought by
Baker Patricia Smith and Baker Gene Stewart
Home Financials for this Owner
Home Financials are based on the most recent Mortgage that was taken out on this home.
Original Mortgage
$130,000
Interest Rate
5.22%
Mortgage Type
New Conventional
Create a Home Valuation Report for This Property
The Home Valuation Report is an in-depth analysis detailing your home's value as well as a comparison with similar homes in the area
Home Values in the Area
Average Home Value in this Area
Purchase History
| Date | Buyer | Sale Price | Title Company |
|---|---|---|---|
| Harrison Jamie Smith | -- | None Available | |
| Baker Patricia S | -- | None Available | |
| Smith-Baker Patrici | -- | -- | |
| Baker Patricia Smith | -- | -- |
Source: Public Records
Mortgage History
| Date | Status | Borrower | Loan Amount |
|---|---|---|---|
| Open | Harrison Jamie Smith | $240,000 | |
| Previous Owner | Baker Patricia Smith | $130,000 |
Source: Public Records
Tax History Compared to Growth
Tax History
| Year | Tax Paid | Tax Assessment Tax Assessment Total Assessment is a certain percentage of the fair market value that is determined by local assessors to be the total taxable value of land and additions on the property. | Land | Improvement |
|---|---|---|---|---|
| 2025 | $2,749 | $379,422 | $26,978 | $352,444 |
| 2024 | $2,413 | $267,419 | $30,000 | $237,419 |
| 2023 | $2,413 | $267,419 | $30,000 | $237,419 |
| 2022 | $2,413 | $267,419 | $30,000 | $237,419 |
| 2021 | $2,407 | $267,419 | $30,000 | $237,419 |
| 2020 | $2,259 | $250,977 | $30,000 | $220,977 |
| 2019 | $2,265 | $250,977 | $30,000 | $220,977 |
| 2018 | $2,227 | $250,977 | $30,000 | $220,977 |
| 2017 | $2,240 | $250,977 | $30,000 | $220,977 |
| 2014 | $2,487 | $282,607 | $30,000 | $252,607 |
| 2013 | -- | $282,607 | $30,000 | $252,607 |
| 2011 | -- | $282,607 | $30,000 | $252,607 |
Source: Public Records
Map
Nearby Homes
- 2886 Fox Run Cir
- 3128 Kelly Rd
- 2912 Fox Run Cir
- 2683 Stokes Cir
- 2673 Stokes Cir
- 2712 Stokes Cir
- 2746 Pinewood Dr
- Lot 2 Branchwood Dr
- 2443 Creekside Rd
- 3145 Lakewood Dr Unit 3155
- 3178 Alton Phillips Rd
- 2585 Cabin Branch Rd
- 2544 Dogwood Ln
- 2193 Dogwood Ln
- 2445 Tammy Dr
- 3255 Caroline Nicole Dr
- 3216 Dexter Cir
- 2704 Forrest Dr
- 2634 Forrest Dr
- 2526 Moulton Dr
- 2802 Nautica Place
- 2182 Thatcher Dr
- 2831 Churchill Dr
- 2853 Churchill Dr
- 2196 Thatcher Dr
- 2809 Churchill Dr
- 2105 Saint Edmunds Cir
- 2877 Churchill Dr
- 2832 Churchill Dr
- 2166 Thatcher Dr
- 2171 Thatcher Dr
- 2195 Thatcher Dr
- 2601 Pauls Path Rd
- 2856 Churchill Dr
- 2807 Fox Run Cir
- 2531 Pauls Path Rd
- 2101 Saint Edmunds Cir
- 2611 Pauls Path Rd
- 2853 Fox Run Cir
- 2630 Pauls Path Rd