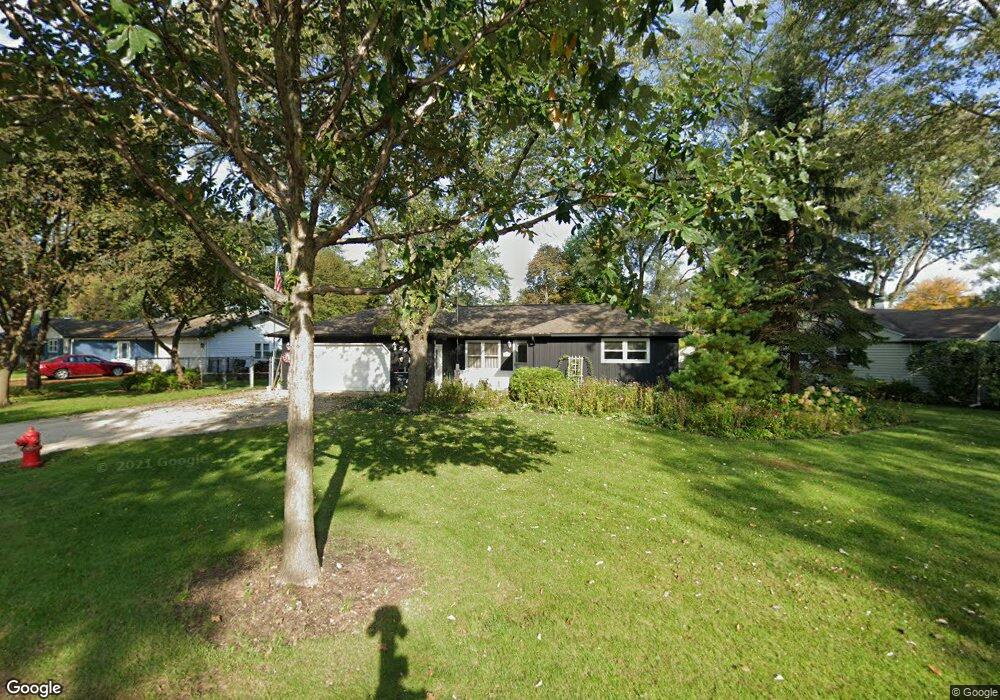
2801 Owl Ln Rolling Meadows, IL 60008
Estimated Value: $396,000 - $441,000
3
Beds
3
Baths
1,785
Sq Ft
$237/Sq Ft
Est. Value
About This Home
This home is located at 2801 Owl Ln, Rolling Meadows, IL 60008 and is currently estimated at $422,567, approximately $236 per square foot. 2801 Owl Ln is a home located in Cook County with nearby schools including Kimball Hill Elementary School, Carl Sandburg Junior High School, and Rolling Meadows High School.
Create a Home Valuation Report for This Property
The Home Valuation Report is an in-depth analysis detailing your home's value as well as a comparison with similar homes in the area
Home Values in the Area
Average Home Value in this Area
Tax History
| Year | Tax Paid | Tax Assessment Tax Assessment Total Assessment is a certain percentage of the fair market value that is determined by local assessors to be the total taxable value of land and additions on the property. | Land | Improvement |
|---|---|---|---|---|
| 2025 | $7,672 | $37,000 | $7,963 | $29,037 |
| 2024 | $7,672 | $31,000 | $6,738 | $24,262 |
| 2023 | $7,292 | $31,000 | $6,738 | $24,262 |
| 2022 | $7,292 | $31,000 | $6,738 | $24,262 |
| 2021 | $5,554 | $22,767 | $3,981 | $18,786 |
| 2020 | $5,556 | $22,767 | $3,981 | $18,786 |
| 2019 | $5,605 | $25,439 | $3,981 | $21,458 |
| 2018 | $6,523 | $26,324 | $3,675 | $22,649 |
| 2017 | $6,425 | $26,324 | $3,675 | $22,649 |
| 2016 | $6,516 | $26,324 | $3,675 | $22,649 |
| 2015 | $6,249 | $24,344 | $3,369 | $20,975 |
| 2014 | $6,128 | $24,344 | $3,369 | $20,975 |
| 2013 | $5,950 | $24,344 | $3,369 | $20,975 |
Source: Public Records
Map
Nearby Homes
- 3265 Kirchoff Rd Unit 116
- 3345 Kirchoff Rd Unit 5C
- 2401 Rohlwing Rd
- 3135 Town Square Dr Unit 401
- 3100 Town Square Dr Unit 308
- 3100 Town Square Dr Unit 204
- 2705 Park St
- 3306 Trillium Cir Unit 3001
- 2600 Brookwood Way Dr Unit 316
- 2600 Brookwood Way Dr Unit 305
- 3209 Trillium Cir
- 2650 Brookwood Way Dr Unit 313
- 2650 Brookwood Way Dr Unit 108
- 2709 Lily Ln
- 3200 Thrush Ln
- 3 Holyoke on Auburn
- 304 E Tall Trees Ln
- 399 Knollwood Ct
- 3710 Meadow Dr
- 3000 California Ave
Your Personal Tour Guide
Ask me questions while you tour the home.