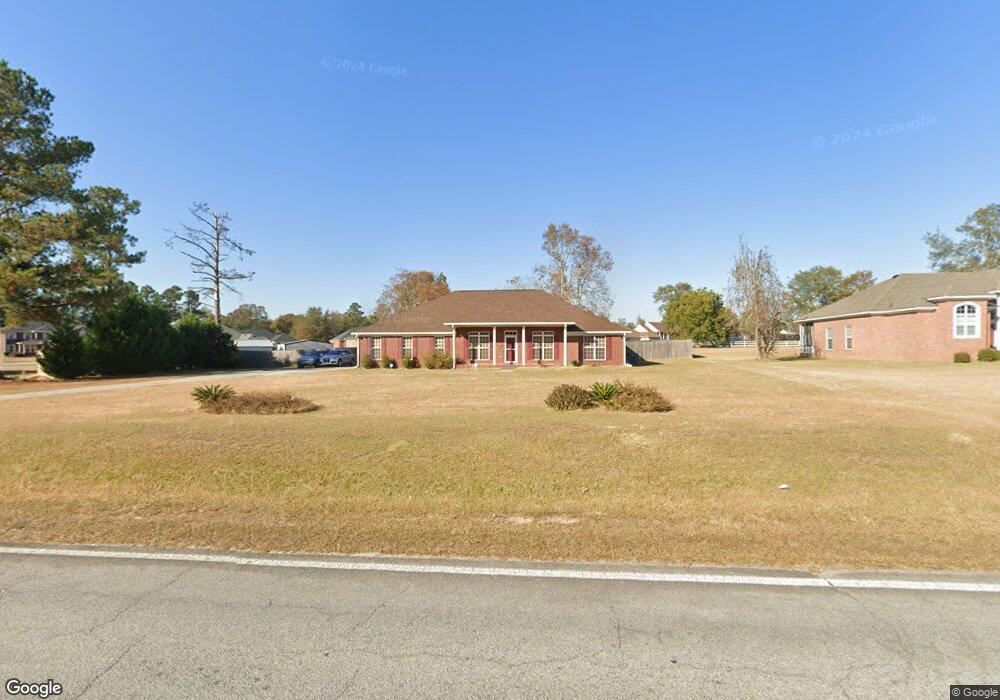
2801 Willis Foreman Rd Hephzibah, GA 30815
Jamestown NeighborhoodEstimated Value: $293,000 - $347,000
4
Beds
4
Baths
2,514
Sq Ft
$124/Sq Ft
Est. Value
About This Home
This home is located at 2801 Willis Foreman Rd, Hephzibah, GA 30815 and is currently estimated at $312,439, approximately $124 per square foot. 2801 Willis Foreman Rd is a home located in Richmond County with nearby schools including Deer Chase Elementary School, Hephzibah Middle School, and Johnson Magnet.
Ownership History
Date
Name
Owned For
Owner Type
Purchase Details
Closed on
Dec 17, 2007
Sold by
Front Line Homes Inc
Bought by
White Jo Ester H
Current Estimated Value
Home Financials for this Owner
Home Financials are based on the most recent Mortgage that was taken out on this home.
Original Mortgage
$215,939
Outstanding Balance
$134,996
Interest Rate
6.15%
Mortgage Type
Purchase Money Mortgage
Estimated Equity
$177,443
Purchase Details
Closed on
Sep 11, 2007
Sold by
Southern Specialty Development Co Inc
Bought by
Front Line Homes Inc
Home Financials for this Owner
Home Financials are based on the most recent Mortgage that was taken out on this home.
Original Mortgage
$167,800
Interest Rate
6.55%
Mortgage Type
Construction
Create a Home Valuation Report for This Property
The Home Valuation Report is an in-depth analysis detailing your home's value as well as a comparison with similar homes in the area
Home Values in the Area
Average Home Value in this Area
Purchase History
| Date | Buyer | Sale Price | Title Company |
|---|---|---|---|
| White Jo Ester H | $227,400 | None Available | |
| Front Line Homes Inc | $28,900 | None Available |
Source: Public Records
Mortgage History
| Date | Status | Borrower | Loan Amount |
|---|---|---|---|
| Open | White Jo Ester H | $215,939 | |
| Previous Owner | Front Line Homes Inc | $167,800 |
Source: Public Records
Tax History Compared to Growth
Tax History
| Year | Tax Paid | Tax Assessment Tax Assessment Total Assessment is a certain percentage of the fair market value that is determined by local assessors to be the total taxable value of land and additions on the property. | Land | Improvement |
|---|---|---|---|---|
| 2025 | $3,584 | $120,896 | $15,920 | $104,976 |
| 2024 | $3,584 | $115,916 | $15,920 | $99,996 |
| 2023 | $2,452 | $104,456 | $15,920 | $88,536 |
| 2022 | $2,869 | $93,320 | $15,920 | $77,400 |
| 2021 | $2,509 | $73,756 | $15,920 | $57,836 |
| 2020 | $2,469 | $73,756 | $15,920 | $57,836 |
| 2019 | $2,620 | $73,756 | $15,920 | $57,836 |
| 2018 | $2,639 | $73,756 | $15,920 | $57,836 |
| 2017 | $2,660 | $74,668 | $15,920 | $58,748 |
| 2016 | $2,662 | $74,668 | $15,920 | $58,748 |
| 2015 | $2,681 | $74,668 | $15,920 | $58,748 |
| 2014 | $2,685 | $74,668 | $15,920 | $58,748 |
Source: Public Records
Map
Nearby Homes
- 2013 Bassford Dr
- 1610 Jonathan Place
- 3955 Lace Rd
- 3955 Lace Rd Unit D
- 3955 Lace Rd Unit B
- 1855 Beaver Creek Ln
- 1914 Mitchell Place
- 2213 Riley Ct
- 1708 Ethan Way
- 1432 Issac Way
- 1764 Deer Chase Ln
- 2897 Lake Michigan Dr
- 2885 Lake Michigan Dr
- 2160 Kaneck Way
- 2914 Ulm Rd
- 4358 Creekview Dr
- 2640 Carrington Dr
- 2877 Pepperdine Dr
- 2614 Sadie Ct
- 2535 Sand Ridge Ct
- 2797 Willis Foreman Rd
- 2004 Walton Farms Dr
- 2002 Walton Farms Dr
- 2006 Walton Farms Dr
- 2008 Walton Farms Dr
- 2793 Willis Foreman Rd
- 2002 Bassford Dr
- 2010 Walton Farms Dr
- 2004 Bassford Dr
- 2005 Walton Farms Dr
- 2003 Walton Farms Dr
- 2001 Walton Farms Dr
- 2006 Bassford Dr
- 2789 Willis Foreman Rd
- 2011 Walton Farms Dr
- 2101 Bradley Ct
- 2007 Walton Farms Dr
- 2001 Bassford Dr
- 2009 Walton Farms Dr
- 2103 Bradley Ct