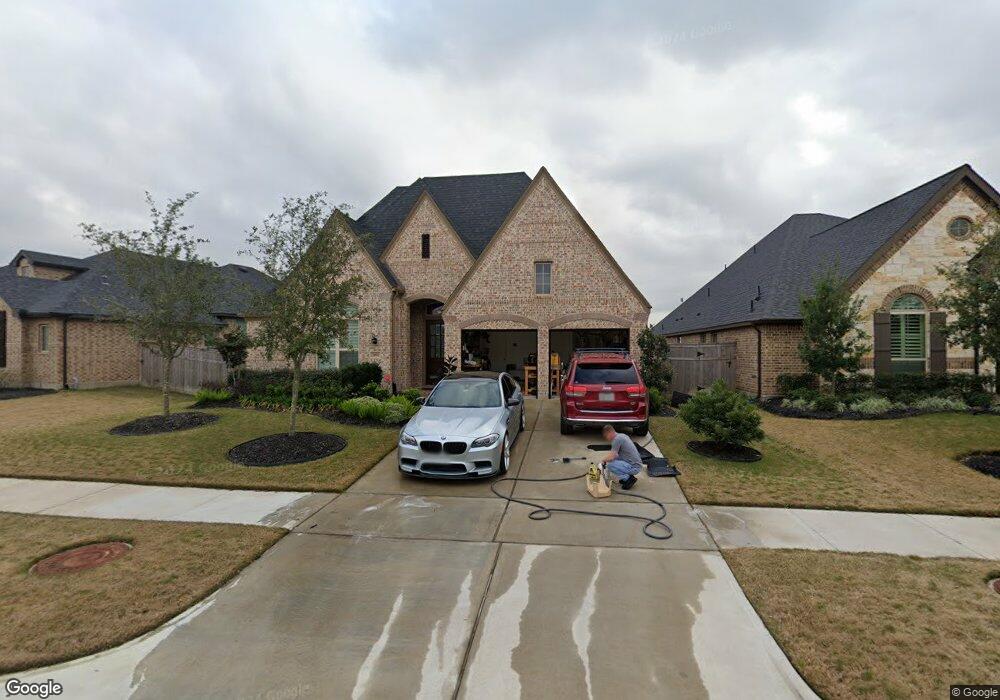
28011 Castle Park Ln Fulshear, TX 77441
Cross Creek Ranch NeighborhoodEstimated Value: $524,000 - $597,000
4
Beds
3
Baths
2,828
Sq Ft
$197/Sq Ft
Est. Value
About This Home
This home is located at 28011 Castle Park Ln, Fulshear, TX 77441 and is currently estimated at $556,518, approximately $196 per square foot. 28011 Castle Park Ln is a home located in Fort Bend County with nearby schools including Campbell Elementary School, Joe M. Adams Junior High, and Sugar Creek Montessori - Fulshear/West Katy.
Ownership History
Date
Name
Owned For
Owner Type
Purchase Details
Closed on
May 21, 2024
Sold by
Champagne Dawn Levell and Champagne Jonathan J
Bought by
Lee Miyoung and Lee Chang Su
Current Estimated Value
Home Financials for this Owner
Home Financials are based on the most recent Mortgage that was taken out on this home.
Original Mortgage
$371,000
Outstanding Balance
$365,798
Interest Rate
6.88%
Mortgage Type
New Conventional
Estimated Equity
$190,720
Purchase Details
Closed on
Apr 12, 2017
Sold by
Highland Homes Houston Llc
Bought by
Champagne Dawn Levell and Champagne Jonathan
Home Financials for this Owner
Home Financials are based on the most recent Mortgage that was taken out on this home.
Original Mortgage
$279,896
Interest Rate
4.1%
Mortgage Type
New Conventional
Purchase Details
Closed on
Jun 22, 2016
Sold by
Ccr Loan Subsidiary 1 Lp
Bought by
Champagne Dawn and Champagne Jonathan
Purchase Details
Closed on
Sep 30, 2015
Sold by
Ccr Loan Subsidiary 1 Lp
Bought by
Champagne Dawn and Champagne Jonathan
Create a Home Valuation Report for This Property
The Home Valuation Report is an in-depth analysis detailing your home's value as well as a comparison with similar homes in the area
Home Values in the Area
Average Home Value in this Area
Purchase History
| Date | Buyer | Sale Price | Title Company |
|---|---|---|---|
| Lee Miyoung | -- | Alamo Title Company | |
| Champagne Dawn Levell | -- | None Available | |
| Champagne Dawn | -- | -- | |
| Champagne Dawn | -- | -- |
Source: Public Records
Mortgage History
| Date | Status | Borrower | Loan Amount |
|---|---|---|---|
| Open | Lee Miyoung | $371,000 | |
| Previous Owner | Champagne Dawn Levell | $279,896 |
Source: Public Records
Tax History Compared to Growth
Tax History
| Year | Tax Paid | Tax Assessment Tax Assessment Total Assessment is a certain percentage of the fair market value that is determined by local assessors to be the total taxable value of land and additions on the property. | Land | Improvement |
|---|---|---|---|---|
| 2025 | $10,357 | $530,000 | $73,138 | $456,862 |
| 2024 | $10,357 | $447,216 | -- | $489,296 |
| 2023 | $10,357 | $406,560 | $0 | $467,592 |
| 2022 | $10,744 | $369,600 | $0 | $408,780 |
| 2021 | $11,231 | $336,000 | $56,260 | $279,740 |
| 2020 | $11,439 | $348,510 | $53,350 | $295,160 |
| 2019 | $11,578 | $323,260 | $53,350 | $269,910 |
| 2018 | $12,085 | $336,950 | $53,350 | $283,600 |
| 2017 | $8,794 | $244,870 | $49,500 | $195,370 |
| 2016 | $1,365 | $38,000 | $38,000 | $0 |
Source: Public Records
Map
Nearby Homes
- 3710 Meadowmist Ct
- 28131 Twin Knolls Ln
- 3843 Desert Springs Ln
- 28410 Vineyard Terrace Ln
- 4218 Brannon Branch Ct
- 3422 Walker Falls Ln
- 3422 Auburn Creek Cir
- 27603 Huggins Crest Ct
- 3438 Cartwright Cliff Ln
- 27514 Wilson Run Ln
- 4110 Addison Ranch Ln
- 28426 Asher Falls Ln
- 27842 Harper Meadow Ln
- 27830 Hunters Rock Ln
- 27834 Hunters Rock Ln
- 3535 Blue Mockingbird St
- 3314 Flint Valley Ln
- 3523 Shearwater St
- 28618 Monarch Cliffs Dr
- 3527 Shearwater St
- 28011 Castle Park Ln
- 28015 Castle Park Ln
- 28019 Castle Park Ln
- 28003 Castle Park Ln
- 28023 Castle Park Ln
- 28023 Castle Park Ln
- 3722 Meadowmist Ct
- 27951 Castle Park Ln
- 28007 Castle Park
- 3723 Meadowmist Ct
- 3719 Meadowmist Ct
- 3718 Meadowmist Ct
- 27947 Castle Park Ln
- 27950 Castle Park Ln
- 3714 Meadowmist Ct
- 28031 Castle Park Ln
- 27943 Castle Park Ln
- 28110 Castle Park Ln
- 3715 Meadowmist Ct
- 28106 Castle Park Ln