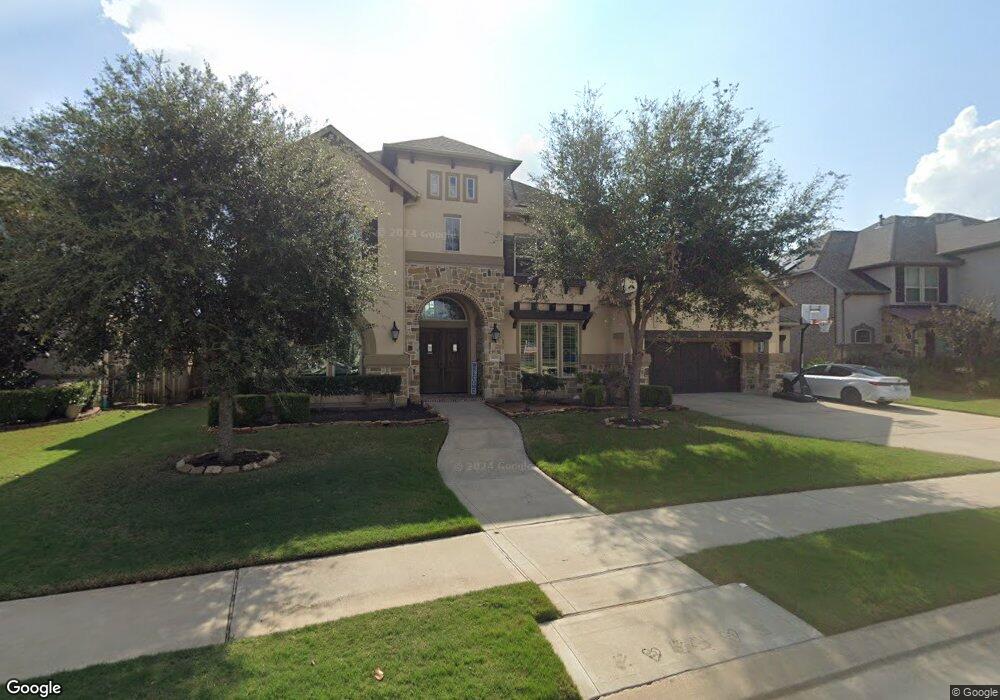
28015 Starlight Harbor Ln Fulshear, TX 77441
Cross Creek Ranch NeighborhoodEstimated Value: $1,095,000 - $1,273,010
5
Beds
6
Baths
5,142
Sq Ft
$230/Sq Ft
Est. Value
About This Home
This home is located at 28015 Starlight Harbor Ln, Fulshear, TX 77441 and is currently estimated at $1,182,003, approximately $229 per square foot. 28015 Starlight Harbor Ln is a home located in Fort Bend County with nearby schools including James E. Randolph Elementary School, Joe M. Adams Junior High, and Sugar Creek Montessori - Fulshear/West Katy.
Ownership History
Date
Name
Owned For
Owner Type
Purchase Details
Closed on
May 22, 2023
Sold by
Morelia Real Estate International Llc
Bought by
Shaikh Sikander and Shaikh Sultana
Current Estimated Value
Home Financials for this Owner
Home Financials are based on the most recent Mortgage that was taken out on this home.
Original Mortgage
$150,000
Interest Rate
6.27%
Mortgage Type
New Conventional
Purchase Details
Closed on
Oct 26, 2022
Sold by
Lee Randall B and Lee Amy J
Bought by
Morelia Real Estate International Llc
Purchase Details
Closed on
Feb 27, 2017
Sold by
Trendmarker Homes Inc
Bought by
Lee Randall B and Wagner Amy J
Home Financials for this Owner
Home Financials are based on the most recent Mortgage that was taken out on this home.
Original Mortgage
$631,000
Interest Rate
3.5%
Mortgage Type
Adjustable Rate Mortgage/ARM
Purchase Details
Closed on
Dec 17, 2015
Sold by
Ccr Loan Subsidiary 1 Lp
Bought by
Lee Randall B and Wagner Amy J
Purchase Details
Closed on
Sep 1, 2015
Sold by
Ccr Loan Subsidiary 1 Lp
Bought by
Lee Randall B and Wagner Amy J
Create a Home Valuation Report for This Property
The Home Valuation Report is an in-depth analysis detailing your home's value as well as a comparison with similar homes in the area
Home Values in the Area
Average Home Value in this Area
Purchase History
| Date | Buyer | Sale Price | Title Company |
|---|---|---|---|
| Shaikh Sikander | -- | None Listed On Document | |
| Morelia Real Estate International Llc | -- | -- | |
| Lee Randall B | -- | First American Title | |
| Lee Randall B | -- | -- | |
| Lee Randall B | -- | -- |
Source: Public Records
Mortgage History
| Date | Status | Borrower | Loan Amount |
|---|---|---|---|
| Closed | Shaikh Sikander | $150,000 | |
| Open | Shaikh Sikander | $726,000 | |
| Previous Owner | Lee Randall B | $631,000 |
Source: Public Records
Tax History Compared to Growth
Tax History
| Year | Tax Paid | Tax Assessment Tax Assessment Total Assessment is a certain percentage of the fair market value that is determined by local assessors to be the total taxable value of land and additions on the property. | Land | Improvement |
|---|---|---|---|---|
| 2025 | $18,348 | $1,265,000 | $163,930 | $1,121,343 |
| 2024 | $18,348 | $1,150,000 | $163,930 | $986,070 |
| 2023 | $32,622 | $1,220,535 | $126,100 | $1,094,435 |
| 2022 | $32,213 | $1,081,510 | $126,100 | $955,410 |
| 2021 | $25,362 | $808,330 | $126,100 | $682,230 |
| 2020 | $25,621 | $791,000 | $121,250 | $669,750 |
| 2019 | $19,509 | $573,260 | $126,100 | $447,160 |
| 2018 | $20,609 | $600,980 | $126,100 | $474,880 |
| 2017 | $15,011 | $433,540 | $100,000 | $333,540 |
| 2016 | $2,770 | $80,000 | $80,000 | $0 |
Source: Public Records
Map
Nearby Homes
- 27919 Starlight Harbor Ln
- 32919 Southern Manors Dr
- 5102 Kendalia Cloud Ln
- 28518 Hoffman Spring Ln
- 5303 Briarcliff Ln
- 5122 Bartlett Vista Ct
- 5310 Briarcliff Ln
- 27842 Harper Meadow Ln
- 27602 Balcones Heights Blvd
- 5603 Avis Hill Ct
- 27602 Lakeway Trail Ln
- 28103 Lockridge Ct
- 4915 Medina Bend Ln
- 5710 Spring River Ln
- 5431 Caspian Falls Ln
- 5815 Mustang Ridge Ln
- 28723 Tara Ridge Ct
- 5719 Spring River Ln
- 4530 Windy Oaks Dr
- 5607 Mustang Ridge Ln
- 28015 Starlight Harbor Ln
- 28011 Starlight Harbor Ln
- 28019 Starlight Harbor Ln
- 28010 Starlight Harbor Ln
- 28007 Starlight Harbor Ln
- 28014 Starlight Harbor Ln
- 28006 Starlight Harbor Ln
- 28023 Starlight Harbor Ln
- 28002 Starlight Harbor Ln
- 28003 Starlight Harbor Ln
- 28027 Starlight Harbor Ln
- 28018 Starlight Harbor Ln
- 28031 Starlight Harbor Ln
- 28011 Skyhaven Ln
- 28003 Skyhaven Ln
- 28007 Skyhaven Ln
- 27943 Starlight Harbor Ln
- 27930 Starlight Harbor Ln
- 28022 Starlight Harbor
- 28035 Starlight Harbor Ln