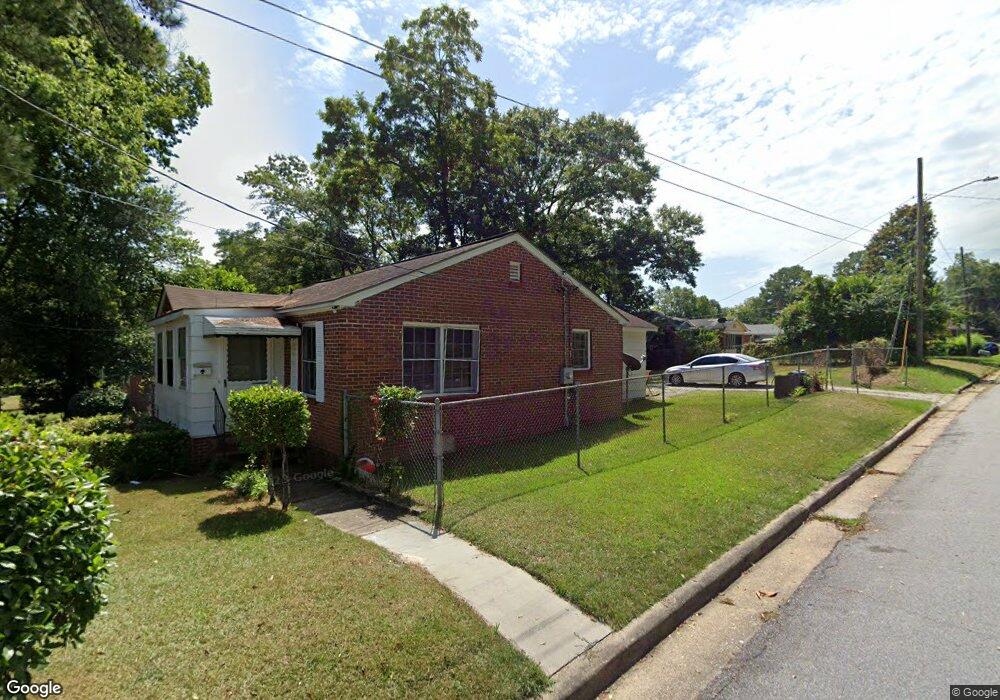
2802 King St Columbus, GA 31906
East Wynnton-Wynnton Hill NeighborhoodEstimated Value: $64,000 - $159,000
3
Beds
2
Baths
1,300
Sq Ft
$68/Sq Ft
Est. Value
About This Home
This home is located at 2802 King St, Columbus, GA 31906 and is currently estimated at $88,691, approximately $68 per square foot. 2802 King St is a home located in Muscogee County with nearby schools including Rigdon Road Elementary School, Rothschild Leadership Academy, and Carver High School.
Ownership History
Date
Name
Owned For
Owner Type
Purchase Details
Closed on
Feb 28, 2024
Sold by
Richardson Thomas M and Mayes Mark F
Bought by
Tramm Investors Llc
Current Estimated Value
Home Financials for this Owner
Home Financials are based on the most recent Mortgage that was taken out on this home.
Original Mortgage
$98,000
Outstanding Balance
$96,388
Interest Rate
6.69%
Mortgage Type
New Conventional
Estimated Equity
-$7,697
Purchase Details
Closed on
Jan 10, 2024
Sold by
Richardson Thomas Michael and Mayes Mark F
Bought by
Tramm Investors Llc
Home Financials for this Owner
Home Financials are based on the most recent Mortgage that was taken out on this home.
Original Mortgage
$98,000
Outstanding Balance
$96,388
Interest Rate
6.69%
Mortgage Type
New Conventional
Estimated Equity
-$7,697
Purchase Details
Closed on
Mar 29, 2023
Sold by
Dsm Rentals Llc
Bought by
Richardson Thomas M and Mayes Mark F
Purchase Details
Closed on
Dec 7, 2018
Sold by
Wells Margo
Bought by
Dsm Rentals Llc
Purchase Details
Closed on
Jul 27, 2007
Sold by
Wells William R
Bought by
Wells Margo
Create a Home Valuation Report for This Property
The Home Valuation Report is an in-depth analysis detailing your home's value as well as a comparison with similar homes in the area
Home Values in the Area
Average Home Value in this Area
Purchase History
| Date | Buyer | Sale Price | Title Company |
|---|---|---|---|
| Tramm Investors Llc | -- | None Listed On Document | |
| Tramm Investors Llc | -- | None Listed On Document | |
| Richardson Thomas M | $55,000 | -- | |
| Dsm Rentals Llc | -- | -- | |
| Wells Margo | $23,000 | None Available |
Source: Public Records
Mortgage History
| Date | Status | Borrower | Loan Amount |
|---|---|---|---|
| Open | Tramm Investors Llc | $98,000 |
Source: Public Records
Tax History
| Year | Tax Paid | Tax Assessment Tax Assessment Total Assessment is a certain percentage of the fair market value that is determined by local assessors to be the total taxable value of land and additions on the property. | Land | Improvement |
|---|---|---|---|---|
| 2025 | $819 | $20,924 | $4,768 | $16,156 |
| 2024 | $819 | $20,924 | $4,768 | $16,156 |
| 2023 | $919 | $23,332 | $4,768 | $18,564 |
| 2022 | $854 | $20,916 | $4,768 | $16,148 |
| 2021 | $852 | $20,860 | $4,768 | $16,092 |
| 2020 | $852 | $20,860 | $4,768 | $16,092 |
| 2019 | $855 | $20,860 | $4,768 | $16,092 |
| 2018 | $855 | $20,860 | $4,768 | $16,092 |
| 2017 | $857 | $20,860 | $4,768 | $16,092 |
| 2016 | $560 | $13,585 | $2,040 | $11,545 |
| 2015 | $561 | $13,585 | $2,040 | $11,545 |
| 2014 | $562 | $13,585 | $2,040 | $11,545 |
| 2013 | -- | $13,585 | $2,040 | $11,545 |
Source: Public Records
Map
Nearby Homes
Your Personal Tour Guide
Ask me questions while you tour the home.