2802 S Henderson Blvd Kilgore, TX 75662
Estimated Value: $291,000 - $344,000
--
Bed
--
Bath
4,238
Sq Ft
$75/Sq Ft
Est. Value
About This Home
This home is located at 2802 S Henderson Blvd, Kilgore, TX 75662 and is currently estimated at $319,439, approximately $75 per square foot. 2802 S Henderson Blvd is a home located in Rusk County with nearby schools including Kilgore Primary School, Chandler Elementary School, and Kilgore Intermediate School.
Ownership History
Date
Name
Owned For
Owner Type
Purchase Details
Closed on
Dec 15, 2005
Sold by
Patton Thomas F and Patton T
Bought by
Jackson Patrick O and Jackson Tashata
Current Estimated Value
Home Financials for this Owner
Home Financials are based on the most recent Mortgage that was taken out on this home.
Original Mortgage
$117,800
Outstanding Balance
$81,483
Interest Rate
10.66%
Mortgage Type
Adjustable Rate Mortgage/ARM
Estimated Equity
$237,956
Create a Home Valuation Report for This Property
The Home Valuation Report is an in-depth analysis detailing your home's value as well as a comparison with similar homes in the area
Home Values in the Area
Average Home Value in this Area
Purchase History
| Date | Buyer | Sale Price | Title Company |
|---|---|---|---|
| Jackson Patrick O | -- | None Available |
Source: Public Records
Mortgage History
| Date | Status | Borrower | Loan Amount |
|---|---|---|---|
| Open | Jackson Patrick O | $117,800 |
Source: Public Records
Tax History Compared to Growth
Tax History
| Year | Tax Paid | Tax Assessment Tax Assessment Total Assessment is a certain percentage of the fair market value that is determined by local assessors to be the total taxable value of land and additions on the property. | Land | Improvement |
|---|---|---|---|---|
| 2024 | $8,097 | $324,220 | $24,270 | $299,950 |
| 2023 | $7,084 | $287,980 | $24,270 | $263,710 |
| 2022 | $6,995 | $257,140 | $19,010 | $238,130 |
| 2021 | $5,430 | $213,830 | $16,400 | $197,430 |
| 2020 | $5,416 | $213,160 | $15,750 | $197,410 |
| 2019 | $5,516 | $211,720 | $13,920 | $197,800 |
| 2018 | $5,644 | $211,720 | $13,920 | $197,800 |
| 2017 | $5,450 | $211,720 | $13,920 | $197,800 |
| 2016 | $5,450 | $211,720 | $13,920 | $197,800 |
| 2015 | -- | $211,720 | $13,920 | $197,800 |
| 2014 | -- | $202,710 | $13,920 | $188,790 |
Source: Public Records
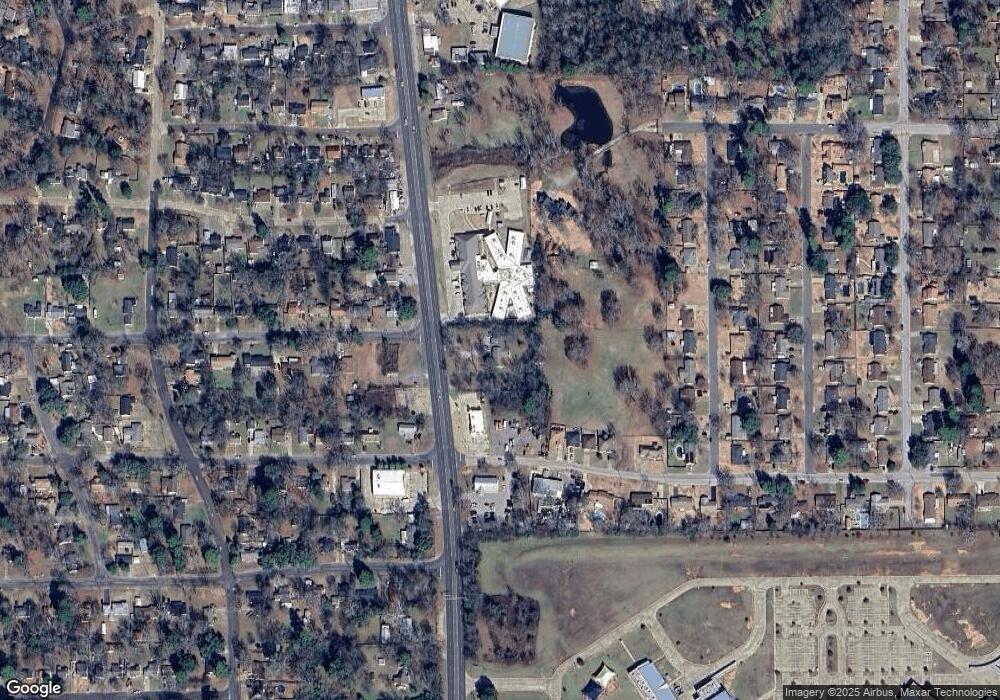
Map
Nearby Homes
- 908 Camp St
- 718 Bean Ave
- 2509 Broadway Blvd
- 1404 Leach St
- 632 Leach St
- 2419 Broadway Blvd
- 624 Camp St
- 509 Turner St
- 619 Peterson Rd
- 2414 S Martin St
- 2617 Florence St
- 501 Beckley St
- 3302 Forrest St
- 2215 Redbud St
- 1115 Roy St
- 1501 Remington Ct
- 1203 Penny Ln
- 402 Beckley St
- 3411 Larkspur Ln
- 2901 Sunset Ln
- 2821 S Henderson Blvd
- 1005 Leach St
- 2825 S Henderson Blvd
- 1007 Leach St
- 2713 S Henderson Blvd
- 925 Emmons St
- 1009 Leach St
- 920 Emmons St
- 1100 Couch St
- 2701 S Henderson Blvd
- TBD Leach St
- 917 Leach St
- 928 Bean Ave
- 913 Leach St
- 922 Bean Ave
- 916 Emmons St
- 923 Emmons St
- 2909 S Henderson Blvd
- 1008 Leach St
- 919 Emmons St