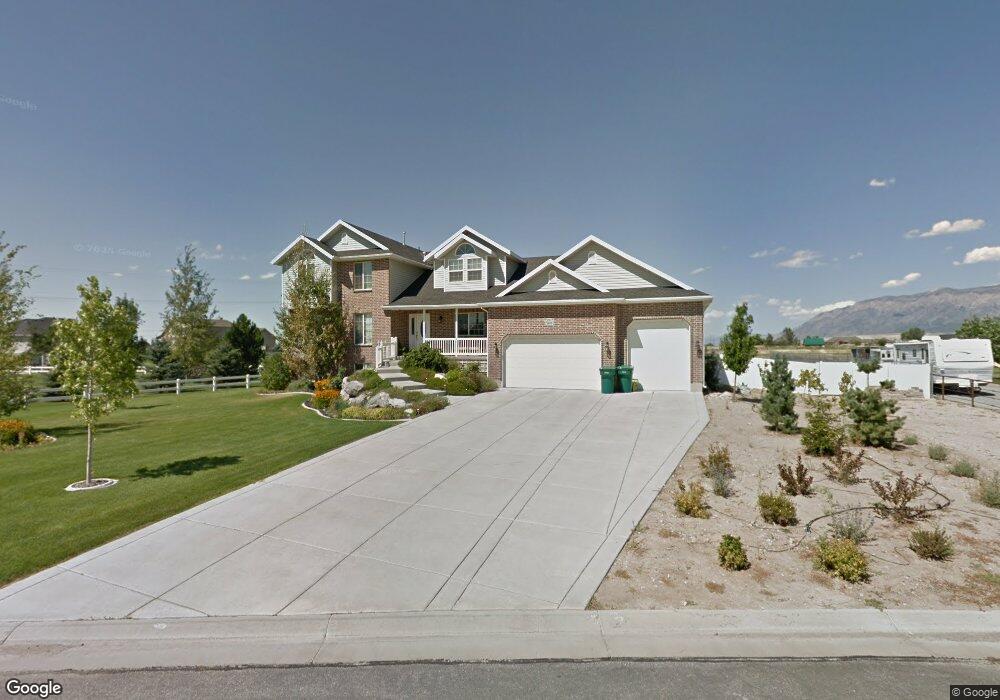
2802 W 2175 S West Haven, UT 84401
Estimated Value: $989,000 - $1,249,783
5
Beds
4
Baths
5,610
Sq Ft
$202/Sq Ft
Est. Value
About This Home
This home is located at 2802 W 2175 S, West Haven, UT 84401 and is currently estimated at $1,131,446, approximately $201 per square foot. 2802 W 2175 S is a home located in Weber County with nearby schools including Deamude Adventist Christian School.
Ownership History
Date
Name
Owned For
Owner Type
Purchase Details
Closed on
Oct 5, 2017
Sold by
Ashmead Stephen D and Ashmead Stacy L
Bought by
Ashmead Stacy L and The Stacy L Ashmead Family Trust
Current Estimated Value
Purchase Details
Closed on
Mar 31, 2005
Sold by
Golden West Builders Inc
Bought by
Ashmead Stephen D and Ashmead Stacy L
Home Financials for this Owner
Home Financials are based on the most recent Mortgage that was taken out on this home.
Original Mortgage
$240,000
Outstanding Balance
$122,400
Interest Rate
5.6%
Mortgage Type
Fannie Mae Freddie Mac
Estimated Equity
$1,009,046
Purchase Details
Closed on
Nov 15, 2004
Sold by
Golden West Builders Inc
Bought by
Golden West Builders Inc
Home Financials for this Owner
Home Financials are based on the most recent Mortgage that was taken out on this home.
Original Mortgage
$278,000
Interest Rate
5.7%
Mortgage Type
Purchase Money Mortgage
Create a Home Valuation Report for This Property
The Home Valuation Report is an in-depth analysis detailing your home's value as well as a comparison with similar homes in the area
Home Values in the Area
Average Home Value in this Area
Purchase History
| Date | Buyer | Sale Price | Title Company |
|---|---|---|---|
| Ashmead Stacy L | -- | None Available | |
| Ashmead Stephen D | -- | Mountain View Title Ogden | |
| Golden West Builders Inc | -- | Boneville Title Company Cle |
Source: Public Records
Mortgage History
| Date | Status | Borrower | Loan Amount |
|---|---|---|---|
| Open | Ashmead Stephen D | $240,000 | |
| Previous Owner | Golden West Builders Inc | $278,000 |
Source: Public Records
Tax History Compared to Growth
Tax History
| Year | Tax Paid | Tax Assessment Tax Assessment Total Assessment is a certain percentage of the fair market value that is determined by local assessors to be the total taxable value of land and additions on the property. | Land | Improvement |
|---|---|---|---|---|
| 2025 | $7,408 | $1,187,988 | $245,449 | $942,539 |
| 2024 | $7,066 | $640,905 | $135,154 | $505,751 |
| 2023 | $7,374 | $674,390 | $131,107 | $543,283 |
| 2022 | $7,048 | $658,350 | $119,874 | $538,476 |
| 2021 | $5,427 | $837,001 | $169,200 | $667,801 |
| 2020 | $4,969 | $710,001 | $134,200 | $575,801 |
| 2019 | $4,691 | $635,000 | $124,450 | $510,550 |
| 2018 | $3,796 | $485,000 | $114,450 | $370,550 |
| 2017 | $3,574 | $445,000 | $101,400 | $343,600 |
| 2016 | $3,494 | $238,217 | $50,338 | $187,879 |
| 2015 | $3,497 | $238,218 | $50,338 | $187,880 |
| 2014 | $3,137 | $206,895 | $42,088 | $164,807 |
Source: Public Records
Map
Nearby Homes
- 2954 W 2325 S
- 3672 3125 W Unit 12
- 2611 W 1850 S
- 1882 S 2475 W
- 2300 Farmhouse Select Plan at Fairhaven
- 1856 S 2425 W
- 1918 S 2475 W
- 1903 S 2425 W
- 1977 S 2425 W
- 2067 S 2425 W
- 2050 Farmhouse Select Plan at Fairhaven
- 1869 S 2425 W
- 1944 S 2425 W
- 3000 Farmhouse Select Plan at Fairhaven
- 3328 W 2100 S
- 2454 W 1775 S
- 2504 W 1725 S
- 2599 S 3075 W
- 2307 W 2525 S
- 1772 S Haven Pkwy