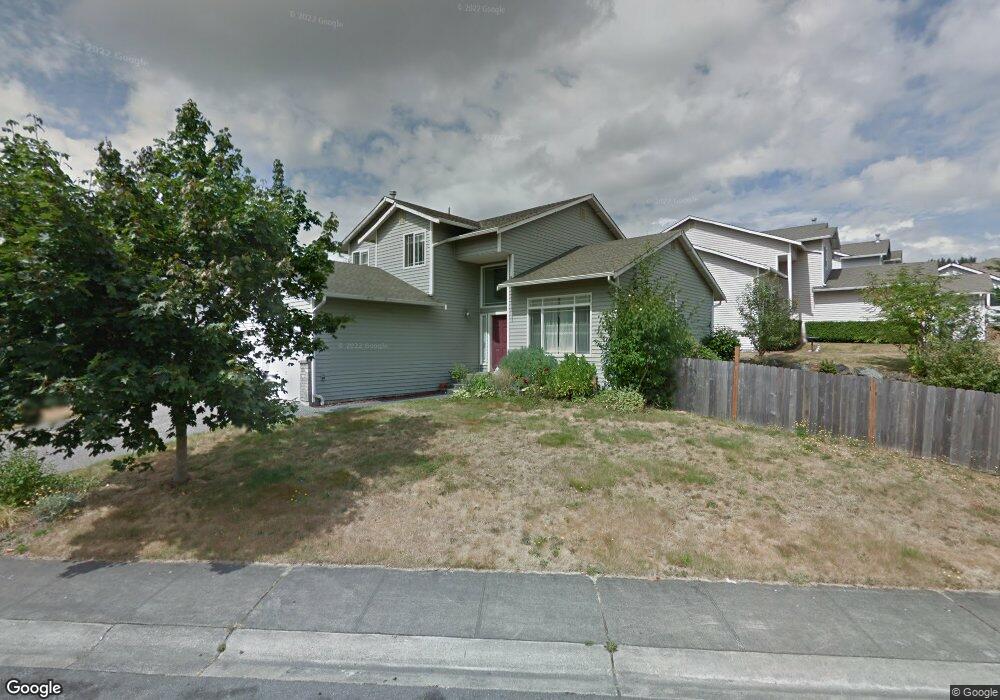
2803 144th St SW Lynnwood, WA 98087
Estimated Value: $740,000 - $850,611
4
Beds
3
Baths
1,749
Sq Ft
$453/Sq Ft
Est. Value
About This Home
This home is located at 2803 144th St SW, Lynnwood, WA 98087 and is currently estimated at $791,903, approximately $452 per square foot. 2803 144th St SW is a home located in Snohomish County with nearby schools including Lake Stickney Elementary School, Voyager Middle School, and Mariner High School.
Ownership History
Date
Name
Owned For
Owner Type
Purchase Details
Closed on
Aug 9, 2011
Sold by
Mose Evans and Mose Karen
Bought by
Ye Zongyuan and Sun Qi
Current Estimated Value
Home Financials for this Owner
Home Financials are based on the most recent Mortgage that was taken out on this home.
Original Mortgage
$90,000
Outstanding Balance
$63,179
Interest Rate
4.87%
Mortgage Type
Adjustable Rate Mortgage/ARM
Estimated Equity
$728,724
Purchase Details
Closed on
May 28, 2008
Sold by
Ryan Erik D and Ryan Janae E
Bought by
Mose Evans and Mose Karen
Home Financials for this Owner
Home Financials are based on the most recent Mortgage that was taken out on this home.
Original Mortgage
$349,414
Interest Rate
5.87%
Mortgage Type
FHA
Purchase Details
Closed on
Aug 9, 2001
Sold by
L & L Ventures Inc
Bought by
Ryan Erik D and Ryan Janae E
Home Financials for this Owner
Home Financials are based on the most recent Mortgage that was taken out on this home.
Original Mortgage
$226,446
Interest Rate
7.19%
Mortgage Type
FHA
Create a Home Valuation Report for This Property
The Home Valuation Report is an in-depth analysis detailing your home's value as well as a comparison with similar homes in the area
Home Values in the Area
Average Home Value in this Area
Purchase History
| Date | Buyer | Sale Price | Title Company |
|---|---|---|---|
| Ye Zongyuan | $238,000 | Old Republic Title Ltd | |
| Mose Evans | $355,180 | First American Title Ins Co | |
| Ryan Erik D | $230,000 | -- |
Source: Public Records
Mortgage History
| Date | Status | Borrower | Loan Amount |
|---|---|---|---|
| Open | Ye Zongyuan | $90,000 | |
| Previous Owner | Mose Evans | $349,414 | |
| Previous Owner | Ryan Erik D | $226,446 |
Source: Public Records
Tax History Compared to Growth
Tax History
| Year | Tax Paid | Tax Assessment Tax Assessment Total Assessment is a certain percentage of the fair market value that is determined by local assessors to be the total taxable value of land and additions on the property. | Land | Improvement |
|---|---|---|---|---|
| 2025 | $5,944 | $706,400 | $453,000 | $253,400 |
| 2024 | $5,944 | $703,400 | $450,000 | $253,400 |
| 2023 | $5,852 | $723,400 | $435,000 | $288,400 |
| 2022 | $4,878 | $507,800 | $263,000 | $244,800 |
| 2020 | $4,408 | $447,200 | $237,000 | $210,200 |
| 2019 | $3,996 | $406,200 | $198,000 | $208,200 |
| 2018 | $1,234 | $327,500 | $167,000 | $160,500 |
| 2017 | $1,333 | $289,300 | $142,000 | $147,300 |
| 2016 | $1,342 | $264,200 | $121,000 | $143,200 |
| 2015 | $3,171 | $260,500 | $113,000 | $147,500 |
| 2013 | $2,474 | $188,800 | $79,000 | $109,800 |
Source: Public Records
Map
Nearby Homes
- 2732 143rd St SW Unit B
- 2733 143rd St SW Unit 35A
- 14322 Admiralty Way Unit 51
- 14322 Admiralty Way Unit 48
- 14322 Admiralty Way Unit 91
- 14322 Admiralty Way Unit 1
- 14322 Admiralty Way Unit 125
- 14714 Admiralty Way Unit A318
- 14715 Admiralty Way Unit B1
- 14715 Admiralty Way Unit 4
- 14902 29th Ave W Unit F101
- 14816 29th Ave W Unit B303
- 14816 29th Ave W Unit B101
- 14816 29th Ave W Unit B102
- 14821 29th Ave W Unit K101
- 14815 29th Ave W Unit J301
- 13332 Lake Rd
- 3326 147th Place SW
- 13629 26th Place W Unit 103
- 3322 148th St SW Unit E4
- 2733 144th St SW
- 2805 144th St SW
- 14413 Admiralty Way
- 2731 144th St SW
- 2732 144th St SW
- 2710 144th St SW
- 14411 Admiralty Way
- 2811 144th St SW
- 2813 144th St SW
- 2729 144th St SW
- 2815 144th Place SW
- 2815 144th Place SW
- 2730 144th St SW
- 2819 144th Place SW Unit 66
- 2823 144th Place SW Unit 65
- 2823 144th Place SW
- 2732 143rd St SW Unit A
- 2732 143rd St SW Unit 2B
- 2732 143rd St SW Unit 2A
- 2732 143rd St SW