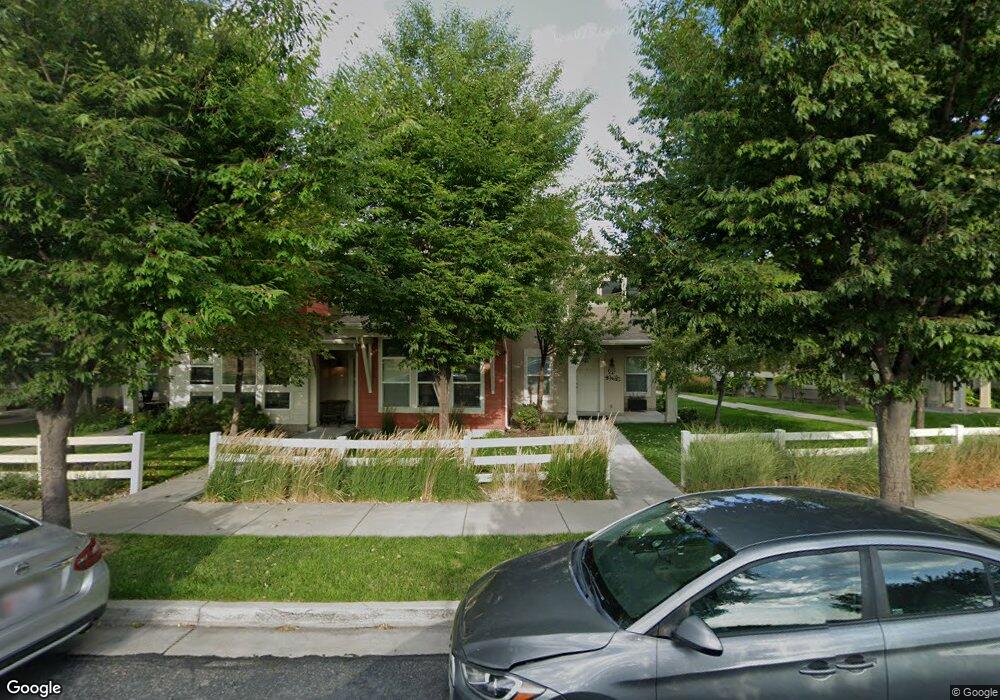
2803 Fairgrove Ln Salt Lake City, UT 84120
Glendale NeighborhoodEstimated Value: $366,560 - $427,000
2
Beds
3
Baths
1,461
Sq Ft
$269/Sq Ft
Est. Value
About This Home
This home is located at 2803 Fairgrove Ln, Salt Lake City, UT 84120 and is currently estimated at $392,640, approximately $268 per square foot. 2803 Fairgrove Ln is a home located in Salt Lake County with nearby schools including Neil Armstrong Academy, West Lake Junior High School, and Granger High School.
Ownership History
Date
Name
Owned For
Owner Type
Purchase Details
Closed on
Dec 16, 2020
Sold by
Ballstaedt Paul
Bought by
3029 Llc
Current Estimated Value
Purchase Details
Closed on
Nov 22, 2013
Sold by
Rillon Shaon D and Rillon Sheila
Bought by
Ballstaedt Paul
Home Financials for this Owner
Home Financials are based on the most recent Mortgage that was taken out on this home.
Original Mortgage
$114,375
Interest Rate
4.23%
Mortgage Type
New Conventional
Purchase Details
Closed on
Jun 24, 2009
Sold by
Rill Shaon and Rillon Sheila
Bought by
Rillon Shaon D and Rillon Sheila
Home Financials for this Owner
Home Financials are based on the most recent Mortgage that was taken out on this home.
Original Mortgage
$195,220
Interest Rate
4.83%
Mortgage Type
VA
Purchase Details
Closed on
Sep 10, 2008
Sold by
Lake Park Development Corp
Bought by
Rillon Shaon and Rillon Sheila
Home Financials for this Owner
Home Financials are based on the most recent Mortgage that was taken out on this home.
Original Mortgage
$193,856
Interest Rate
6.5%
Mortgage Type
VA
Create a Home Valuation Report for This Property
The Home Valuation Report is an in-depth analysis detailing your home's value as well as a comparison with similar homes in the area
Home Values in the Area
Average Home Value in this Area
Purchase History
| Date | Buyer | Sale Price | Title Company |
|---|---|---|---|
| 3029 Llc | -- | Pioneer Title Ins Agcy | |
| Ballstaedt Paul | -- | First American Title | |
| Rillon Shaon D | -- | Landmark Title | |
| Rillon Shaon | -- | Landmark Title |
Source: Public Records
Mortgage History
| Date | Status | Borrower | Loan Amount |
|---|---|---|---|
| Previous Owner | Ballstaedt Paul | $114,375 | |
| Previous Owner | Rillon Shaon D | $195,220 | |
| Previous Owner | Rillon Shaon | $193,856 |
Source: Public Records
Tax History Compared to Growth
Tax History
| Year | Tax Paid | Tax Assessment Tax Assessment Total Assessment is a certain percentage of the fair market value that is determined by local assessors to be the total taxable value of land and additions on the property. | Land | Improvement |
|---|---|---|---|---|
| 2025 | $2,269 | $373,600 | $44,400 | $329,200 |
| 2024 | $2,269 | $346,400 | $41,900 | $304,500 |
| 2023 | $2,194 | $320,600 | $38,100 | $282,500 |
| 2022 | $0 | $325,400 | $37,000 | $288,400 |
| 2021 | $1,943 | $255,900 | $28,600 | $227,300 |
| 2020 | $1,846 | $229,400 | $25,200 | $204,200 |
| 2019 | $1,823 | $218,500 | $25,200 | $193,300 |
| 2018 | $1,685 | $195,100 | $29,100 | $166,000 |
| 2017 | $1,530 | $180,100 | $29,100 | $151,000 |
| 2016 | $1,419 | $167,300 | $39,200 | $128,100 |
| 2015 | $1,502 | $168,700 | $47,900 | $120,800 |
| 2014 | $1,422 | $156,400 | $45,100 | $111,300 |
Source: Public Records
Map
Nearby Homes
- 3057 S Finsbury Ln
- 2858 S Ritter Row Unit 51
- 2865 S Ritter Row Unit 55
- Ronan Plan at Bonneville Towns
- 2857 S Ritter Row Unit 57
- 2868 S Ritter Row
- 2858 S Ritter Row
- 2853 S Kinsey Ct Unit 46
- 2892 Malcolm Place Unit 13
- 2886 S Malcolm Place
- 2888 S Malcolm Place
- 2892 S Malcolm Place
- 2894 S Malcolm Place
- 2830 S Keltic Ct
- 5767 W Kintail Ct
- 3017 Jamboree St Unit 12
- 2947 S Calypso St
- 3174 S Park Commons Way
- 2448 S Anna Caroline Dr
- 6081 Parkway Blvd Unit STAND
- 2809 S Fairgrove Ln
- 2809 Fairgrove Ln
- 2801 Fairgrove Ln
- 2815 Fairgrove Ln
- 2819 Fairgrove Ln
- 2807 S Fairgrove Ln
- 2807 Fairgrove Ln
- 2815 S Fairgrove Ln
- 2803 S Fairgrove Ln
- 2819 S Fairgrove Ln
- 2801 S Fairgrove Ln
- 2801 S Fairgrove Ln Unit 5-4
- 2821 S Fairgrove Ln
- 5428 W Green Grove Ln
- 5428 Green Grove Ln
- 2823 Fairgrove Ln
- 2823 S Fairgrove Ln
- 5430 W Green Grove Ln
- 5422 Fairgrove Ln
- 5422 W Fairgrove Ln