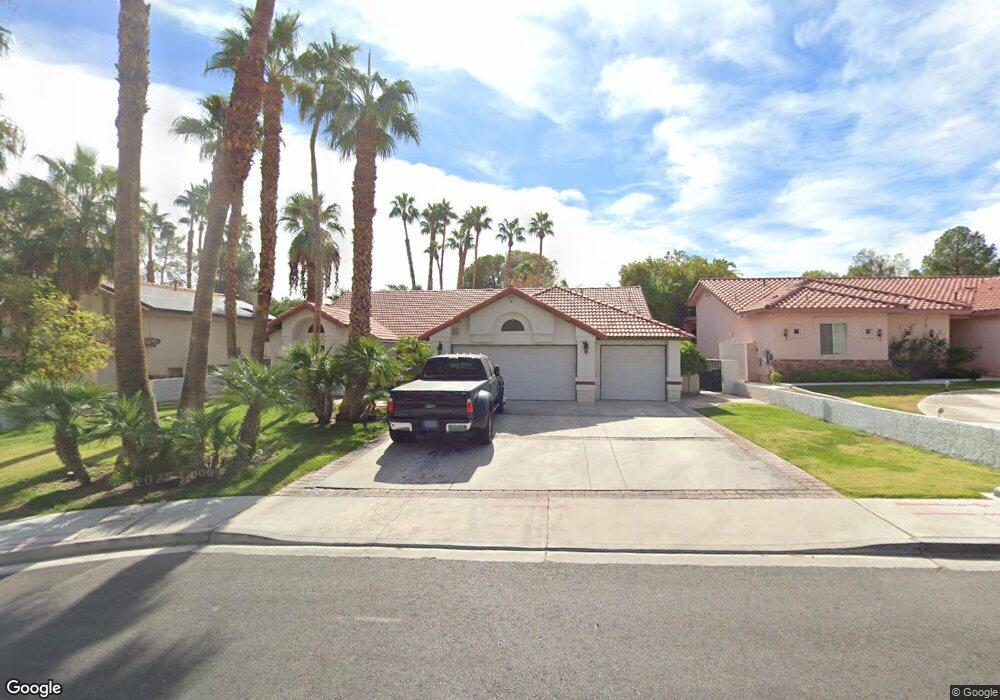
2803 High View Dr Henderson, NV 89014
Green Valley North NeighborhoodEstimated Value: $725,000 - $858,000
3
Beds
3
Baths
3,027
Sq Ft
$268/Sq Ft
Est. Value
About This Home
This home is located at 2803 High View Dr, Henderson, NV 89014 and is currently estimated at $809,729, approximately $267 per square foot. 2803 High View Dr is a home located in Clark County with nearby schools including Estes M Mcdoniel Elementary School, Barbara and Hank Greenspun Junior High School, and Green Valley High School.
Ownership History
Date
Name
Owned For
Owner Type
Purchase Details
Closed on
Aug 30, 2002
Sold by
Beebe Cathleen A
Bought by
Beebe Edward J and Beebe Cathleen A
Current Estimated Value
Purchase Details
Closed on
May 22, 1995
Sold by
Lake At Las Vegas Joint Venture
Bought by
Pangonis Ralph L and Pangonis Sandra K
Home Financials for this Owner
Home Financials are based on the most recent Mortgage that was taken out on this home.
Original Mortgage
$297,500
Interest Rate
8.51%
Mortgage Type
Seller Take Back
Purchase Details
Closed on
Feb 6, 1994
Sold by
Pangonis Ralph L and Pangonis Sandra
Bought by
Pangonis Ralph L and Pangonis Sandra
Create a Home Valuation Report for This Property
The Home Valuation Report is an in-depth analysis detailing your home's value as well as a comparison with similar homes in the area
Home Values in the Area
Average Home Value in this Area
Purchase History
| Date | Buyer | Sale Price | Title Company |
|---|---|---|---|
| Beebe Edward J | -- | -- | |
| Beebe Cathleen A | -- | -- | |
| Pangonis Ralph L | $350,000 | First American Title Company | |
| Pangonis Ralph L | -- | Old Republic Title Company |
Source: Public Records
Mortgage History
| Date | Status | Borrower | Loan Amount |
|---|---|---|---|
| Previous Owner | Pangonis Ralph L | $297,500 |
Source: Public Records
Tax History
| Year | Tax Paid | Tax Assessment Tax Assessment Total Assessment is a certain percentage of the fair market value that is determined by local assessors to be the total taxable value of land and additions on the property. | Land | Improvement |
|---|---|---|---|---|
| 2026 | $3,706 | $186,458 | $87,500 | $98,958 |
| 2025 | $3,598 | $183,000 | $80,500 | $102,500 |
| 2024 | $3,493 | $183,000 | $80,500 | $102,500 |
| 2023 | $3,493 | $181,688 | $84,000 | $97,688 |
| 2022 | $3,392 | $146,433 | $56,000 | $90,433 |
| 2021 | $3,293 | $136,729 | $50,400 | $86,329 |
| 2020 | $3,194 | $131,617 | $45,500 | $86,117 |
| 2019 | $3,101 | $130,825 | $45,500 | $85,325 |
| 2018 | $3,011 | $128,284 | $45,500 | $82,784 |
| 2017 | $3,768 | $130,004 | $45,500 | $84,504 |
| 2016 | $2,851 | $119,921 | $35,000 | $84,921 |
| 2015 | $2,845 | $111,028 | $31,500 | $79,528 |
| 2014 | $2,762 | $92,518 | $18,200 | $74,318 |
Source: Public Records
Map
Nearby Homes
- 2504 Balintore Ct
- 2817 High View Dr
- 2488 Marlene Way
- 2472 Marlene Way
- 2775 Durness Ct Unit 1
- 795 Sunrise Crossing St
- 2520 Kilmaron Cir
- 675 Cervantes Dr
- 1900 Equinox Ridge Way
- 666 Cervantes Dr
- 639 Pepper Tree Cir Unit A
- 2329 Richard Dr
- 2446 Pickwick Dr
- 542 Cervantes Dr
- 1979 Cutlass Dr Unit 72
- 2415 Pickwick Dr Unit 50
- 2231 Marlboro Dr
- 2379 Pickwick Dr
- 2220 Marlboro Dr
- 1915 Cutlass Dr Unit 104
- 2805 High View Dr
- 2801 High View Dr
- 2802 La Mesa Dr
- 2807 High View Dr
- 2807 High View Dr
- 2800 La Mesa Dr
- 2804 La Mesa Dr
- 2506 Balintore Ct
- 2508 Balintore Ct
- 2510 Balintore Ct
- 2809 High View Dr
- 2504 Balintore Ct
- 2400 Greens Ave
- 2402 Greens Ave Unit 1A
- 2806 La Mesa Dr
- 2502 Balintore Ct
- 2404 Greens Ave
- 2500 Balintore Ct Unit n/a
- 2500 Balintore Ct
- 2406 Greens Ave
Your Personal Tour Guide
Ask me questions while you tour the home.