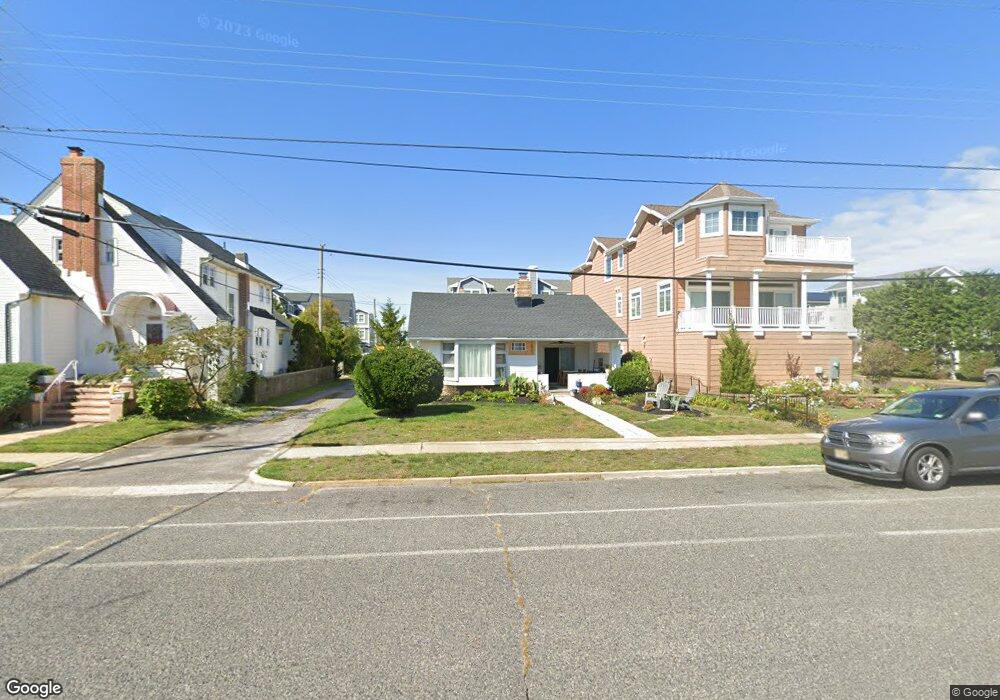
2803 Ocean Ave Brigantine, NJ 08203
Estimated Value: $963,000 - $1,212,000
3
Beds
2
Baths
1,400
Sq Ft
$781/Sq Ft
Est. Value
About This Home
This home is located at 2803 Ocean Ave, Brigantine, NJ 08203 and is currently estimated at $1,093,634, approximately $781 per square foot. 2803 Ocean Ave is a home located in Atlantic County with nearby schools including Brigantine Elementary School and New Hope Christian Academy/Robinson Small Learning Center.
Ownership History
Date
Name
Owned For
Owner Type
Purchase Details
Closed on
Jul 9, 2021
Sold by
Kids Future Properties Llc
Bought by
Bussey Tom Shane and Kurland Jennifer S
Current Estimated Value
Home Financials for this Owner
Home Financials are based on the most recent Mortgage that was taken out on this home.
Original Mortgage
$548,000
Outstanding Balance
$497,225
Interest Rate
2.9%
Mortgage Type
New Conventional
Estimated Equity
$596,409
Purchase Details
Closed on
May 9, 2008
Sold by
Foust John and Foust Joan
Bought by
Kids Future Properties Llc
Purchase Details
Closed on
Mar 3, 1999
Sold by
Luger Roselyn and Ingrum Zenaida
Bought by
Foust John and Foust Joan
Home Financials for this Owner
Home Financials are based on the most recent Mortgage that was taken out on this home.
Original Mortgage
$128,000
Interest Rate
6.73%
Purchase Details
Closed on
Sep 17, 1992
Sold by
Doring Jacquelene
Bought by
Lauger Roselyn and Lauger Ingrom,Zenaida
Create a Home Valuation Report for This Property
The Home Valuation Report is an in-depth analysis detailing your home's value as well as a comparison with similar homes in the area
Home Values in the Area
Average Home Value in this Area
Purchase History
| Date | Buyer | Sale Price | Title Company |
|---|---|---|---|
| Bussey Tom Shane | $777,000 | Surety Title Company | |
| Kids Future Properties Llc | $635,000 | Commonwealth Land Title Insu | |
| Foust John | $160,000 | Commonwealth Land Title Ins | |
| Lauger Roselyn | -- | -- |
Source: Public Records
Mortgage History
| Date | Status | Borrower | Loan Amount |
|---|---|---|---|
| Open | Bussey Tom Shane | $548,000 | |
| Previous Owner | Foust John | $128,000 |
Source: Public Records
Tax History
| Year | Tax Paid | Tax Assessment Tax Assessment Total Assessment is a certain percentage of the fair market value that is determined by local assessors to be the total taxable value of land and additions on the property. | Land | Improvement |
|---|---|---|---|---|
| 2025 | $8,272 | $440,000 | $410,600 | $29,400 |
| 2024 | $8,272 | $440,000 | $410,600 | $29,400 |
Source: Public Records
Map
Nearby Homes
- 403 28th St S
- 312 31st St S
- 2502 Ocean Ave
- 2905 Revere Blvd
- 3318 W Brigantine Ave Unit 3
- 345 35th St S Unit A
- 3007 Bayshore Ave Unit 4
- 3007 Bayshore Ave Unit 12
- 327 36th St S Unit B
- 2500 Bayshore Ave
- 201 23rd St S
- 106 24th St S
- 103 24th St S
- 3512 Bayshore Ave
- 301 20th St S
- 1904 W Brigantine Ave
- 251 38th St S
- 245 38th St S Unit A
- 314 41st St S
- 223 40th St S
Your Personal Tour Guide
Ask me questions while you tour the home.