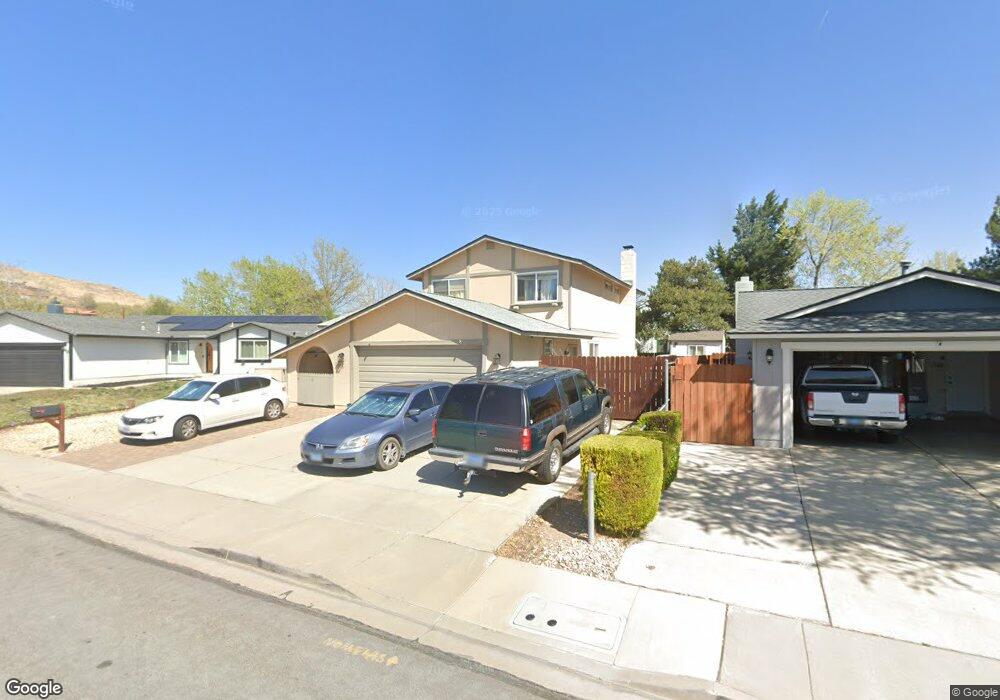
2803 Pinewood Dr Unit 4 Sparks, NV 89434
Reed NeighborhoodEstimated Value: $502,664 - $594,000
4
Beds
3
Baths
2,128
Sq Ft
$256/Sq Ft
Est. Value
About This Home
This home is located at 2803 Pinewood Dr Unit 4, Sparks, NV 89434 and is currently estimated at $545,666, approximately $256 per square foot. 2803 Pinewood Dr Unit 4 is a home located in Washoe County with nearby schools including Hershal H. Beam Elementary School, Lena Juniper Elementary School, and Lou Mendive Middle School.
Ownership History
Date
Name
Owned For
Owner Type
Purchase Details
Closed on
Apr 21, 2011
Sold by
Price Heather
Bought by
Price Larry R
Current Estimated Value
Home Financials for this Owner
Home Financials are based on the most recent Mortgage that was taken out on this home.
Original Mortgage
$126,704
Interest Rate
4.99%
Mortgage Type
FHA
Purchase Details
Closed on
Mar 10, 2011
Sold by
Us Bank National Association
Bought by
Price Larry R
Home Financials for this Owner
Home Financials are based on the most recent Mortgage that was taken out on this home.
Original Mortgage
$126,704
Interest Rate
4.99%
Mortgage Type
FHA
Purchase Details
Closed on
Jan 8, 2011
Sold by
Williams Matthew and Williams Therese
Bought by
Us Bank National Association
Purchase Details
Closed on
Apr 6, 1998
Sold by
Ohair Patrick J and Ohair Nancy K
Bought by
Williams Matthew and Williams Therese
Home Financials for this Owner
Home Financials are based on the most recent Mortgage that was taken out on this home.
Original Mortgage
$141,550
Interest Rate
7.15%
Create a Home Valuation Report for This Property
The Home Valuation Report is an in-depth analysis detailing your home's value as well as a comparison with similar homes in the area
Home Values in the Area
Average Home Value in this Area
Purchase History
| Date | Buyer | Sale Price | Title Company |
|---|---|---|---|
| Price Larry R | -- | Ticor Title Reno | |
| Price Larry R | $130,000 | Ticor Title Reno | |
| Us Bank National Association | $281,022 | Accommodation | |
| Williams Matthew | $149,000 | Stewart Title |
Source: Public Records
Mortgage History
| Date | Status | Borrower | Loan Amount |
|---|---|---|---|
| Previous Owner | Price Larry R | $126,704 | |
| Previous Owner | Williams Matthew | $141,550 |
Source: Public Records
Tax History Compared to Growth
Tax History
| Year | Tax Paid | Tax Assessment Tax Assessment Total Assessment is a certain percentage of the fair market value that is determined by local assessors to be the total taxable value of land and additions on the property. | Land | Improvement |
|---|---|---|---|---|
| 2025 | $2,778 | $70,583 | $36,120 | $34,463 |
| 2024 | $2,714 | $68,871 | $33,215 | $35,656 |
| 2023 | $1,318 | $69,770 | $35,175 | $34,595 |
| 2022 | $2,385 | $56,277 | $26,740 | $29,537 |
| 2021 | $1,719 | $51,773 | $21,735 | $30,038 |
| 2020 | $1,668 | $51,451 | $20,720 | $30,731 |
| 2019 | $2,388 | $51,066 | $20,720 | $30,346 |
| 2018 | $2,751 | $44,612 | $14,455 | $30,157 |
| 2017 | $1,526 | $44,437 | $13,720 | $30,717 |
| 2016 | $1,488 | $44,094 | $12,250 | $31,844 |
| 2015 | $1,486 | $42,841 | $10,325 | $32,516 |
| 2014 | $1,443 | $40,598 | $9,030 | $31,568 |
| 2013 | -- | $38,344 | $6,860 | $31,484 |
Source: Public Records
Map
Nearby Homes
- 1069 Palmwood Dr
- 3602 Oakridge Dr
- 1031 Vintage Hills Pkwy
- 1035 Baywood Dr Unit D
- 930 Spanish Springs Rd
- 1029 Baywood Dr Unit D
- 1128 Bradley Square
- 3200 Bristle Branch Dr
- 3198 Bristle Branch Dr
- 3188 Bristle Branch Dr
- 3345 Groom Way
- 3167 Bristle Branch Dr
- 3988 Ella Jayne Ct Unit Lot 6
- 1095 E York Way
- 1575 Olinghouse St
- Plan 4 at Eagle Peak
- Plan 5 at Eagle Peak
- Plan 2 at Eagle Peak
- Plan 1 at Eagle Peak
- Plan 3 at Eagle Peak
- 2703 Pinewood Dr
- 2903 Pinewood Dr Unit ID1250760P
- 2903 Pinewood Dr
- 1005 Sunnybrook Ln
- 2603 Pinewood Dr
- 995 Sunnybrook Ln
- 3003 Pinewood Dr
- 1015 Sunnybrook Ln
- 985 Sunnybrook Ln
- 2708 Pinewood Dr
- 2808 Pinewood Dr
- 1025 Sunnybrook Ln
- 2503 Pinewood Dr
- 2608 Pinewood Dr
- 2606 Palmwood Dr
- 975 Sunnybrook Ln
- 2806 Palmwood Dr
- 1909 Palmwood Ct Unit 4
- 2508 Pinewood Dr
- 2403 Pinewood Dr