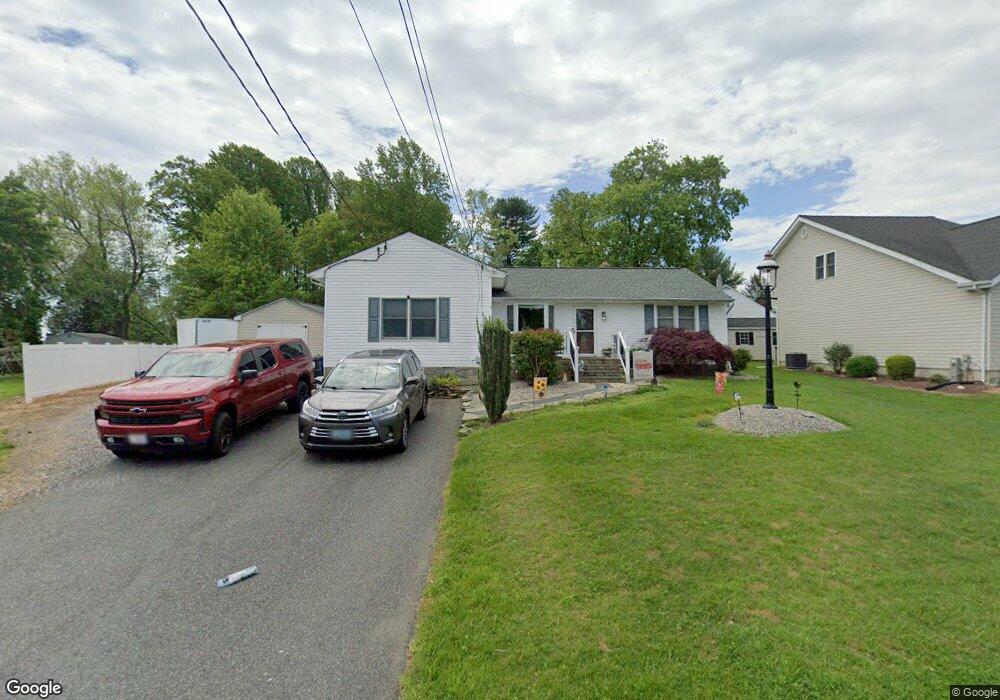
2803 Preston Ln Abingdon, MD 21009
Estimated Value: $322,960 - $424,000
Studio
1
Bath
1,428
Sq Ft
$253/Sq Ft
Est. Value
About This Home
This home is located at 2803 Preston Ln, Abingdon, MD 21009 and is currently estimated at $361,740, approximately $253 per square foot. 2803 Preston Ln is a home located in Harford County with nearby schools including William S. James Elementary School, Patterson Mill Middle School, and Patterson Mill High School.
Ownership History
Date
Name
Owned For
Owner Type
Purchase Details
Closed on
Nov 13, 1995
Sold by
Pilo Anthony R
Bought by
Borlie Michael A and Borlie Charlotte A
Current Estimated Value
Purchase Details
Closed on
May 28, 1985
Sold by
Miller Norman
Bought by
Pilo Anthony R
Home Financials for this Owner
Home Financials are based on the most recent Mortgage that was taken out on this home.
Original Mortgage
$41,000
Interest Rate
12.83%
Purchase Details
Closed on
Jan 13, 1983
Sold by
Turner Larry W
Bought by
Miller Norman
Home Financials for this Owner
Home Financials are based on the most recent Mortgage that was taken out on this home.
Original Mortgage
$39,402
Interest Rate
13.46%
Create a Home Valuation Report for This Property
The Home Valuation Report is an in-depth analysis detailing your home's value as well as a comparison with similar homes in the area
Home Values in the Area
Average Home Value in this Area
Purchase History
| Date | Buyer | Sale Price | Title Company |
|---|---|---|---|
| Borlie Michael A | $93,500 | -- | |
| Pilo Anthony R | $58,500 | -- | |
| Miller Norman | $49,500 | -- |
Source: Public Records
Mortgage History
| Date | Status | Borrower | Loan Amount |
|---|---|---|---|
| Previous Owner | Pilo Anthony R | $41,000 | |
| Previous Owner | Miller Norman | $39,402 | |
| Closed | Borlie Michael A | -- |
Source: Public Records
Tax History
| Year | Tax Paid | Tax Assessment Tax Assessment Total Assessment is a certain percentage of the fair market value that is determined by local assessors to be the total taxable value of land and additions on the property. | Land | Improvement |
|---|---|---|---|---|
| 2025 | $2,351 | $227,833 | $0 | $0 |
| 2024 | $2,351 | $216,567 | $0 | $0 |
| 2023 | $2,238 | $205,300 | $91,800 | $113,500 |
| 2022 | $2,215 | $203,200 | $0 | $0 |
| 2021 | $2,296 | $201,100 | $0 | $0 |
| 2020 | $2,296 | $199,000 | $91,800 | $107,200 |
| 2019 | $2,296 | $199,000 | $91,800 | $107,200 |
| 2018 | $2,276 | $199,000 | $91,800 | $107,200 |
| 2017 | $2,397 | $209,600 | $0 | $0 |
| 2016 | -- | $206,800 | $0 | $0 |
| 2015 | $2,322 | $204,000 | $0 | $0 |
| 2014 | $2,322 | $201,200 | $0 | $0 |
Source: Public Records
Map
Nearby Homes
- 2802 Haddaway Ct
- 2902 Preston Ln
- 20 Huxley Cir
- 311 Laurel Woods Dr
- 104 Singer Rd
- 2818 Singer Woods Dr
- 301 Tall Pines Ct Unit A
- 113 Laurel Valley Ct
- 108 Laurel Valley Ct
- 2712 Parallel Path
- 419 Clydebank Dr
- 2930 Haddington Ct
- 2513 Kenna Ct Unit 7
- 2815 Lanarkshire Way
- 221 Glen View Terrace
- 2923 Alconbury Ct
- 2934 Strathaven Ln
- 2917 Brightwater Ln
- 236 Lodgecliff Ct
- 311 Tiree Ct Unit 401
- 2803A Preston Ln
- 2805 Preston Ln
- 2807 Preston Ln
- 2804 Preston Ln
- 2802 Preston Ln
- 2806 Preston Ln
- 2710 Emmorton Rd
- 2801 Preston Ln
- 2808 Preston Ln
- 2809 Preston Ln
- 2708 Emmorton Rd
- 2802 Emmorton Rd
- 2810 Preston Ln
- 2811 Preston Ln
- 2733 Singer Woods Dr
- 2735 Singer Woods Dr
- 2706 Emmorton Rd
- 2812 Preston Ln
- 2731 Singer Woods Dr
- 2737 Singer Woods Dr
Your Personal Tour Guide
Ask me questions while you tour the home.