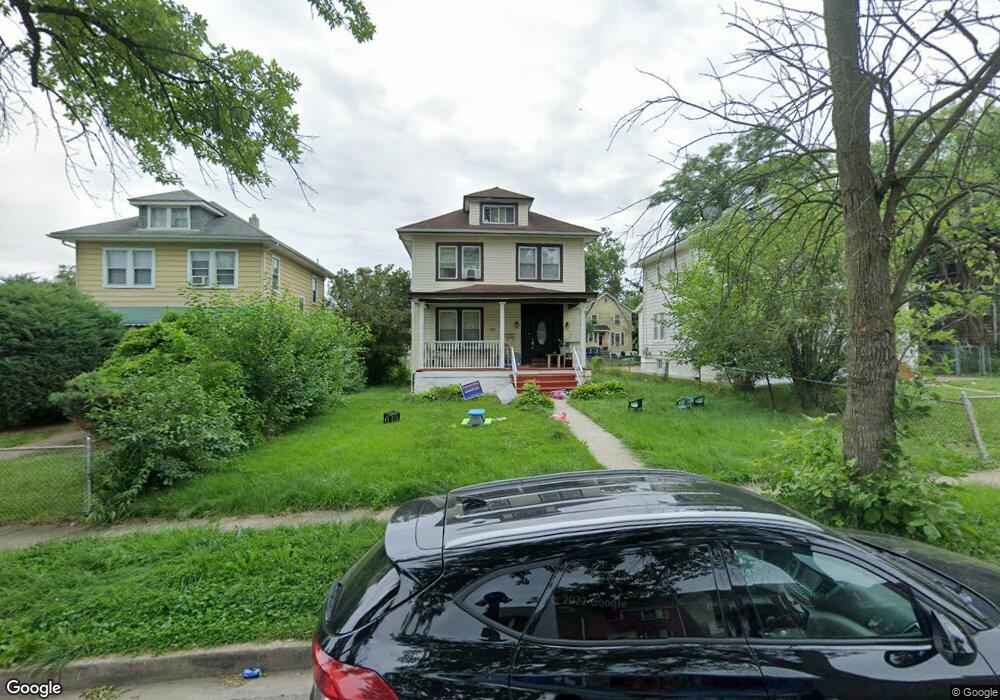
2803 W Garrison Ave Baltimore, MD 21215
Cylburn NeighborhoodEstimated Value: $172,000 - $241,645
4
Beds
1
Bath
2,142
Sq Ft
$97/Sq Ft
Est. Value
About This Home
This home is located at 2803 W Garrison Ave, Baltimore, MD 21215 and is currently estimated at $206,823, approximately $96 per square foot. 2803 W Garrison Ave is a home located in Baltimore City with nearby schools including Pimlico Elementary School, Booker T. Washington Middle School, and Forest Park High School.
Ownership History
Date
Name
Owned For
Owner Type
Purchase Details
Closed on
Nov 21, 2023
Sold by
One House At A Time Inc
Bought by
Eagle Homes Usa Llc
Current Estimated Value
Purchase Details
Closed on
Jan 10, 2022
Sold by
Henry Raymond
Bought by
Eagle Homes Usa Llc
Purchase Details
Closed on
Oct 30, 2009
Sold by
Verasammy Ramasammy
Bought by
Eagle Homes Usa Llc
Purchase Details
Closed on
Nov 17, 2005
Sold by
Johnson Charmaine
Bought by
Verasammy Ramasammy and Verasammy Homemattie
Purchase Details
Closed on
Jul 22, 2005
Sold by
Johnson Charmaine
Bought by
Verasammy Ramasammy and Verasammy Homemattie
Purchase Details
Closed on
Dec 10, 2004
Sold by
Burnett Bertha L
Bought by
Ge Mortgage Services Llc
Purchase Details
Closed on
Aug 16, 2004
Sold by
Burnett Bertha L
Bought by
Ge Mortgage Services Llc
Purchase Details
Closed on
Jan 22, 1997
Sold by
Harper House Investment
Bought by
Burnett Bertha L and Burnett Lydia T
Create a Home Valuation Report for This Property
The Home Valuation Report is an in-depth analysis detailing your home's value as well as a comparison with similar homes in the area
Home Values in the Area
Average Home Value in this Area
Purchase History
| Date | Buyer | Sale Price | Title Company |
|---|---|---|---|
| Eagle Homes Usa Llc | $30,000 | Eagle Premier Title | |
| Eagle Homes Usa Llc | $1,731 | None Listed On Document | |
| Eagle Homes Usa Llc | -- | -- | |
| Verasammy Ramasammy | -- | -- | |
| Johnson Charmaine | $64,000 | -- | |
| Verasammy Ramasammy | -- | -- | |
| Johnson Charmaine | $64,000 | -- | |
| Ge Mortgage Services Llc | $45,500 | -- | |
| Ge Mortgage Services Llc | $45,500 | -- | |
| Burnett Bertha L | $29,900 | -- |
Source: Public Records
Tax History
| Year | Tax Paid | Tax Assessment Tax Assessment Total Assessment is a certain percentage of the fair market value that is determined by local assessors to be the total taxable value of land and additions on the property. | Land | Improvement |
|---|---|---|---|---|
| 2025 | $2,680 | $121,467 | -- | -- |
| 2024 | $2,680 | $114,100 | $30,300 | $83,800 |
| 2023 | $2,573 | $109,533 | $0 | $0 |
| 2022 | $2,477 | $104,967 | $0 | $0 |
| 2021 | $2,369 | $100,400 | $30,300 | $70,100 |
| 2020 | $2,356 | $99,833 | $0 | $0 |
| 2019 | $2,332 | $99,267 | $0 | $0 |
| 2018 | $2,329 | $98,700 | $30,300 | $68,400 |
| 2017 | $2,270 | $96,200 | $0 | $0 |
| 2016 | $2,655 | $93,700 | $0 | $0 |
| 2015 | $2,655 | $91,200 | $0 | $0 |
| 2014 | $2,655 | $91,200 | $0 | $0 |
Source: Public Records
Map
Nearby Homes
- 2846 Oakley Ave
- 2859 W Garrison Ave
- 2911 Thorndale Ave
- 4903 Chalgrove Ave
- 2725 Uhler Ave
- 4830 Pimlico Rd
- 4818 Pimlico Rd
- 4807 Lanier Ave
- 2926 Oakley Ave
- 4911 Queensberry Ave
- 2924 Virginia Ave
- 2904 Virginia Ave
- 5135 Pembridge Ave
- 2834 Virginia Ave
- 4702 Pimlico Rd
- 2912 Dupont Ave
- 3012 Dupont Ave
- 3035 W Belvedere Ave
- 2311 Pennyroyal Terrace
- 2303 Bayleaf Ct
- 2801 W Garrison Ave
- 2805 W Garrison Ave
- 2807 W Garrison Ave
- 2809 W Garrison Ave
- 2731 W Garrison Ave
- 2802 Oakley Ave
- 2800 Oakley Ave
- 2804 Oakley Ave
- 2811 W Garrison Ave
- 2729 W Garrison Ave
- 2804 W Garrison Ave
- 2802 W Garrison Ave
- 2806 W Garrison Ave
- 2808 W Garrison Ave
- 2806 Oakley Ave
- 2800 W Garrison Ave
- 2810 W Garrison Ave
- 2812 W Garrison Ave
- 2726 Oakley Ave
- 2727 W Garrison Ave
Your Personal Tour Guide
Ask me questions while you tour the home.