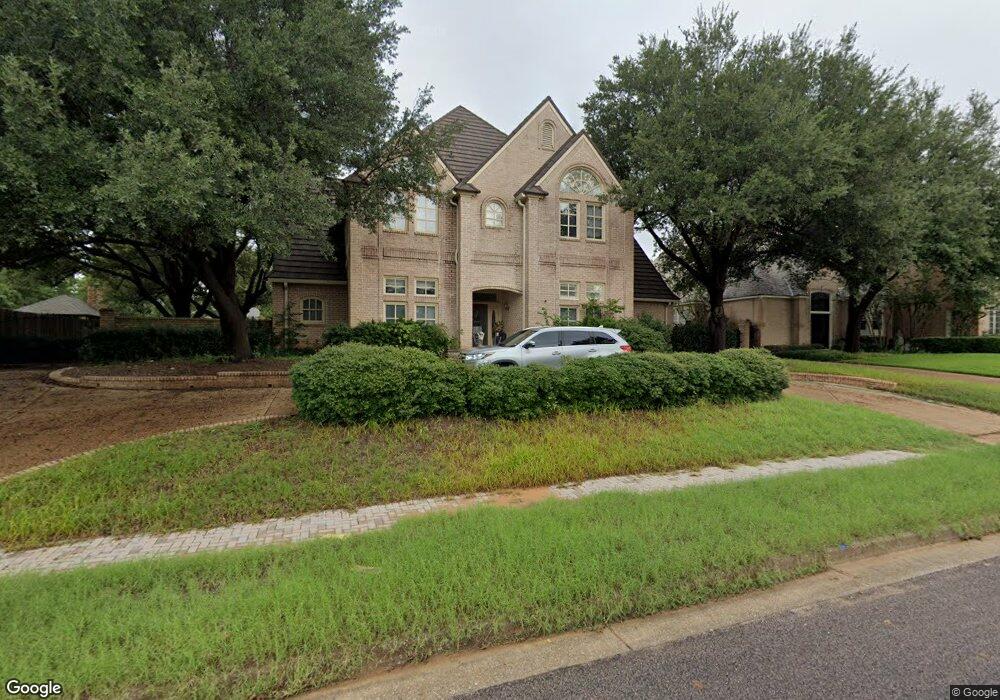
2804 Meadowview Dr Colleyville, TX 76034
Estimated Value: $1,048,380 - $1,266,000
5
Beds
4
Baths
3,967
Sq Ft
$286/Sq Ft
Est. Value
About This Home
This home is located at 2804 Meadowview Dr, Colleyville, TX 76034 and is currently estimated at $1,134,595, approximately $286 per square foot. 2804 Meadowview Dr is a home located in Tarrant County with nearby schools including O.C. Taylor Elementary School, Colleyville Middle School, and Waypoint Montessori.
Ownership History
Date
Name
Owned For
Owner Type
Purchase Details
Closed on
Jun 6, 2005
Sold by
Messer Robert Scott and Messer Barbara
Bought by
Welman Eric C and Welman Jacqualine
Current Estimated Value
Home Financials for this Owner
Home Financials are based on the most recent Mortgage that was taken out on this home.
Original Mortgage
$334,500
Outstanding Balance
$174,854
Interest Rate
5.78%
Mortgage Type
Fannie Mae Freddie Mac
Estimated Equity
$959,741
Purchase Details
Closed on
Mar 12, 1999
Sold by
Motgi Gurubasappa V and Motgi Shashi Raj
Bought by
Messer Robert Scott and Schlosser Barbara
Home Financials for this Owner
Home Financials are based on the most recent Mortgage that was taken out on this home.
Original Mortgage
$274,000
Interest Rate
6.75%
Create a Home Valuation Report for This Property
The Home Valuation Report is an in-depth analysis detailing your home's value as well as a comparison with similar homes in the area
Home Values in the Area
Average Home Value in this Area
Purchase History
| Date | Buyer | Sale Price | Title Company |
|---|---|---|---|
| Welman Eric C | -- | Allegiance Title | |
| Messer Robert Scott | -- | American Title Co |
Source: Public Records
Mortgage History
| Date | Status | Borrower | Loan Amount |
|---|---|---|---|
| Open | Welman Eric C | $334,500 | |
| Previous Owner | Messer Robert Scott | $274,000 | |
| Closed | Messer Robert Scott | $34,250 |
Source: Public Records
Tax History Compared to Growth
Tax History
| Year | Tax Paid | Tax Assessment Tax Assessment Total Assessment is a certain percentage of the fair market value that is determined by local assessors to be the total taxable value of land and additions on the property. | Land | Improvement |
|---|---|---|---|---|
| 2025 | $3,345 | $788,581 | $250,930 | $537,651 |
| 2024 | $3,345 | $821,439 | $250,930 | $570,509 |
| 2023 | $13,260 | $912,094 | $250,930 | $661,164 |
| 2022 | $14,114 | $728,596 | $250,930 | $477,666 |
| 2021 | $14,267 | $649,641 | $151,860 | $497,781 |
| 2020 | $13,199 | $649,640 | $151,860 | $497,780 |
| 2019 | $12,485 | $540,000 | $150,000 | $390,000 |
| 2018 | $3,299 | $555,000 | $150,000 | $405,000 |
| 2017 | $12,189 | $549,462 | $125,000 | $424,462 |
| 2016 | $11,081 | $533,563 | $125,000 | $408,563 |
| 2015 | $9,683 | $426,400 | $65,000 | $361,400 |
| 2014 | $9,683 | $426,400 | $65,000 | $361,400 |
Source: Public Records
Map
Nearby Homes
- 2906 Edgewood Ln
- 4282 Hearthside Dr
- 2906 Cottonwood Ln
- 4214 Hearthside Dr
- 4213 Hearthside Dr
- 3301 Queensbury Way W
- 3321 Circlewood Ct
- 4309 Meandering Way
- 4723 Bill Simmons Rd
- 3409 Crossgate Cir N
- 4300 Eaton Cir
- 4816 Bill Simmons Rd
- 3329 Moss Creek Dr
- 3278 Birch Ave
- 3216 Glade Rd
- 2904 Hickory Hill Ln
- 4612 Bill Simmons Rd
- 2904 Hickory Hill St
- 2201 Oak Knoll Ct
- 5504 Sycamore Dr
- 2800 Meadowview Dr
- 2808 Meadowview Dr
- 2712 Meadowview Dr
- 2900 Meadowview Dr
- 2803 Meadowview Dr
- 2715 Meadowview Dr
- 4904 Shadycreek Ln
- 2708 Meadowview Dr
- 2904 Meadowview Dr
- 4903 Wildwood Ct
- 4900 Shadycreek Ln
- 2711 Meadowview Dr
- 2704 Meadowview Dr
- 4904 Wildwood Ct
- 2908 Meadowview Dr
- 4900 Wildwood Ct
- 4808 Shadycreek Ln
- 2707 Meadowview Dr
- 2900 Glade Rd
- 2700 Meadowview Dr