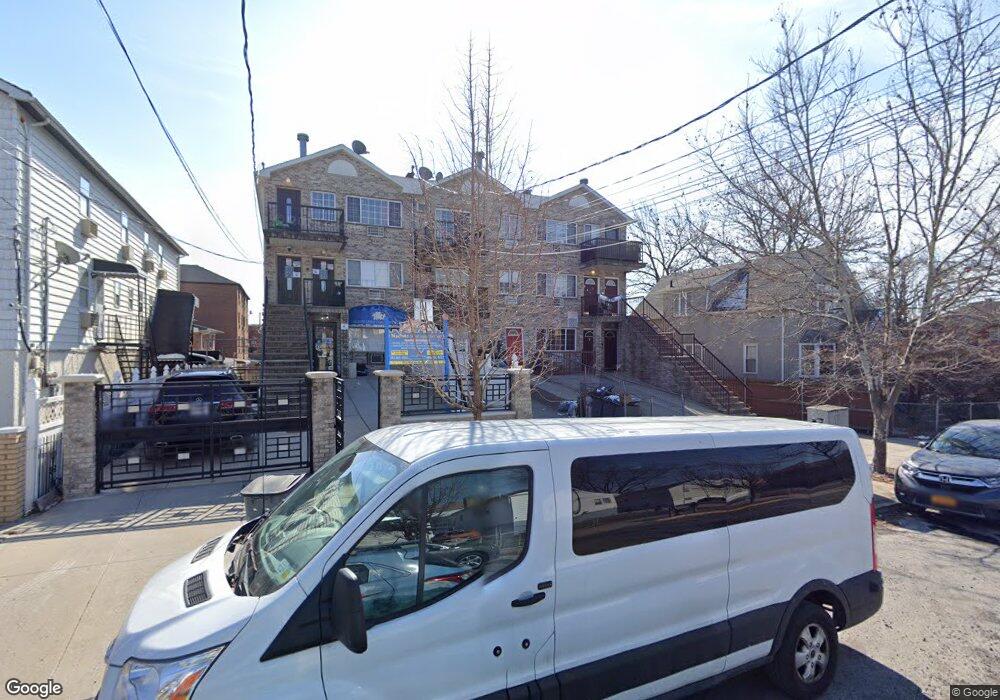
2804 Miles Ave Unit 2806 Bronx, NY 10465
Throgs Neck-Edgewater Park NeighborhoodEstimated Value: $1,106,000 - $1,473,000
--
Bed
--
Bath
3,405
Sq Ft
$380/Sq Ft
Est. Value
About This Home
This home is located at 2804 Miles Ave Unit 2806, Bronx, NY 10465 and is currently estimated at $1,295,482, approximately $380 per square foot. 2804 Miles Ave Unit 2806 is a home located in Bronx County with nearby schools including P.S. 72 - Dr. William Dorney, Herbert H Lehman High School, and St. Frances de Chantal School.
Ownership History
Date
Name
Owned For
Owner Type
Purchase Details
Closed on
Jul 18, 2011
Sold by
Gormally Andrew
Bought by
G G G Properties Llc
Current Estimated Value
Purchase Details
Closed on
Feb 7, 2011
Sold by
Gorm Ent Llc
Bought by
Gormally Andrew
Purchase Details
Closed on
Sep 5, 2006
Sold by
Doris Lyons Llc % Kathleen Bradshaw
Bought by
Gorm Ent Llc
Home Financials for this Owner
Home Financials are based on the most recent Mortgage that was taken out on this home.
Original Mortgage
$533,000
Interest Rate
6.39%
Mortgage Type
Purchase Money Mortgage
Purchase Details
Closed on
Feb 6, 2004
Sold by
Velez Ramon
Bought by
Doris Lyons Llc
Home Financials for this Owner
Home Financials are based on the most recent Mortgage that was taken out on this home.
Original Mortgage
$1,115,000
Interest Rate
5.75%
Mortgage Type
Purchase Money Mortgage
Create a Home Valuation Report for This Property
The Home Valuation Report is an in-depth analysis detailing your home's value as well as a comparison with similar homes in the area
Home Values in the Area
Average Home Value in this Area
Purchase History
| Date | Buyer | Sale Price | Title Company |
|---|---|---|---|
| G G G Properties Llc | -- | -- | |
| Gormally Andrew | -- | -- | |
| Gorm Ent Llc | $301,286 | -- | |
| Doris Lyons Llc | $70,000 | -- |
Source: Public Records
Mortgage History
| Date | Status | Borrower | Loan Amount |
|---|---|---|---|
| Previous Owner | Gorm Ent Llc | $533,000 | |
| Previous Owner | Doris Lyons Llc | $1,115,000 |
Source: Public Records
Tax History Compared to Growth
Tax History
| Year | Tax Paid | Tax Assessment Tax Assessment Total Assessment is a certain percentage of the fair market value that is determined by local assessors to be the total taxable value of land and additions on the property. | Land | Improvement |
|---|---|---|---|---|
| 2025 | $9,371 | $49,455 | $7,724 | $41,731 |
| 2024 | $9,371 | $46,656 | $7,563 | $39,093 |
| 2023 | $9,475 | $46,656 | $6,592 | $40,064 |
| 2022 | $9,244 | $67,620 | $9,240 | $58,380 |
| 2021 | $9,194 | $54,900 | $9,240 | $45,660 |
| 2020 | $8,724 | $51,240 | $9,240 | $42,000 |
| 2019 | $8,133 | $48,480 | $9,240 | $39,240 |
| 2018 | $7,926 | $38,880 | $8,293 | $30,587 |
| 2017 | $1,276 | $38,588 | $8,778 | $29,810 |
| 2016 | $1,251 | $36,404 | $8,678 | $27,726 |
| 2015 | $854 | $34,344 | $9,549 | $24,795 |
| 2014 | $854 | $32,400 | $10,260 | $22,140 |
Source: Public Records
Map
Nearby Homes
- 266 Swinton Ave
- 283 Calhoun Ave
- 2857 Lawton Ave
- 235 Quincy Ave
- 238 Swinton Ave
- 244 Revere Ave
- 310 Huntington Ave
- 2832 Harding Ave
- 2834 Harding Ave
- 2737 Lawton Ave
- 2819 Collis Place
- 329 Revere Ave
- 189 Swinton Ave
- 352 Swinton Ave
- 4175 E Tremont Ave
- 338 Balcom Ave
- 4246 E Tremont Ave Unit MF
- 180 Swinton Ave
- 269 Balcom Ave
- 4016 E Tremont Ave
- 2804-2806 Miles Ave
- 2806 Miles Ave
- 2802 Miles Ave
- 2810 Miles Ave
- 2800 Miles Ave
- 286 Swinton Ave
- 2814 Miles Ave
- 2818 Miles Ave
- 284 Swinton Ave
- 2816 Miles Ave
- 282 Swinton Ave
- 280 Swinton Ave
- 279 Quincy Ave
- 278 Swinton Ave
- 2820 Miles Ave
- 276 Swinton Ave
- 275 Quincy Ave
- 291 Swinton Ave
- 295 Swinton Ave
- 272 Swinton Ave