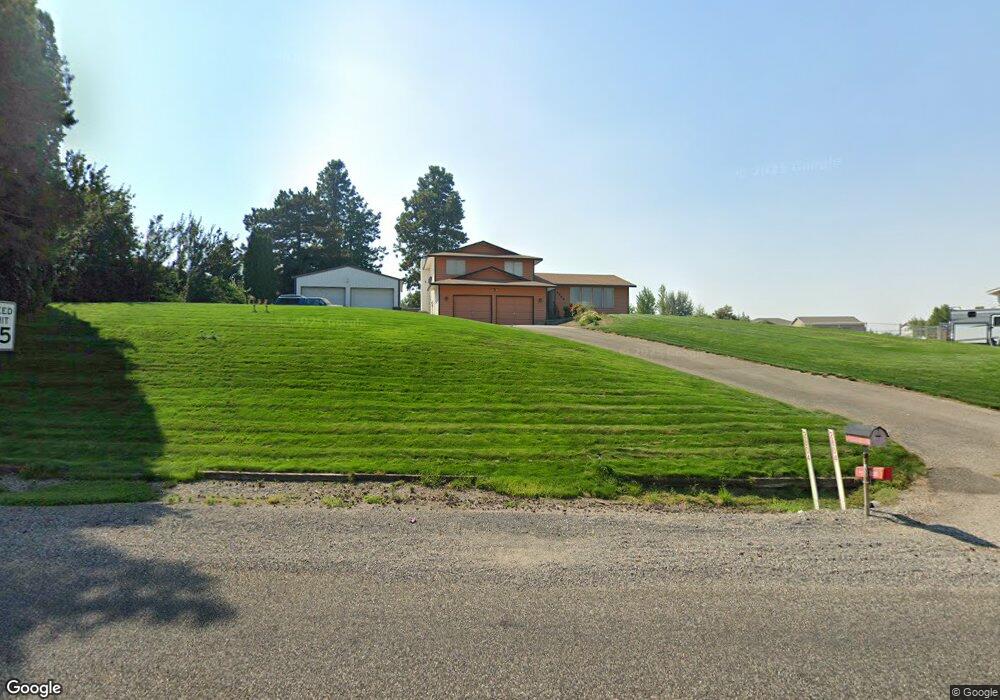
2804 S Bermuda Rd Kennewick, WA 99338
Estimated Value: $556,458 - $736,000
3
Beds
2
Baths
1,848
Sq Ft
$329/Sq Ft
Est. Value
About This Home
This home is located at 2804 S Bermuda Rd, Kennewick, WA 99338 and is currently estimated at $608,115, approximately $329 per square foot. 2804 S Bermuda Rd is a home located in Benton County with nearby schools including Cottonwood Elementary School, Desert Hills Middle School, and Kamiakin High School.
Ownership History
Date
Name
Owned For
Owner Type
Purchase Details
Closed on
Nov 13, 2019
Sold by
Raymond Richard G and Raymond Violet L
Bought by
Raymond Richard G
Current Estimated Value
Home Financials for this Owner
Home Financials are based on the most recent Mortgage that was taken out on this home.
Original Mortgage
$58,000
Outstanding Balance
$50,923
Interest Rate
3.5%
Mortgage Type
New Conventional
Estimated Equity
$557,192
Purchase Details
Closed on
Oct 29, 2018
Sold by
Raymond Richard G and Riggle Nancy E
Bought by
Raymond Richard G
Home Financials for this Owner
Home Financials are based on the most recent Mortgage that was taken out on this home.
Original Mortgage
$160,000
Outstanding Balance
$140,110
Interest Rate
4.6%
Mortgage Type
New Conventional
Estimated Equity
$468,005
Purchase Details
Closed on
Dec 14, 2016
Sold by
Raymond John R
Bought by
Raymond John R and Raymond Violet L
Create a Home Valuation Report for This Property
The Home Valuation Report is an in-depth analysis detailing your home's value as well as a comparison with similar homes in the area
Home Values in the Area
Average Home Value in this Area
Purchase History
| Date | Buyer | Sale Price | Title Company |
|---|---|---|---|
| Raymond Richard G | -- | None Available | |
| Raymond Richard G | $200,000 | Benton Franklin Title Co | |
| Raymond John R | -- | None Available |
Source: Public Records
Mortgage History
| Date | Status | Borrower | Loan Amount |
|---|---|---|---|
| Open | Raymond Richard G | $58,000 | |
| Open | Raymond Richard G | $160,000 |
Source: Public Records
Tax History Compared to Growth
Tax History
| Year | Tax Paid | Tax Assessment Tax Assessment Total Assessment is a certain percentage of the fair market value that is determined by local assessors to be the total taxable value of land and additions on the property. | Land | Improvement |
|---|---|---|---|---|
| 2024 | $4,347 | $447,010 | $184,400 | $262,610 |
| 2023 | $4,347 | $482,420 | $184,400 | $298,020 |
| 2022 | $2,852 | $277,850 | $77,700 | $200,150 |
| 2021 | $3,757 | $260,180 | $77,700 | $182,480 |
| 2020 | $3,904 | $336,710 | $77,700 | $259,010 |
| 2019 | $3,126 | $336,710 | $77,700 | $259,010 |
| 2018 | $2,886 | $277,850 | $77,700 | $200,150 |
| 2017 | $2,637 | $213,090 | $77,700 | $135,390 |
| 2016 | $2,673 | $211,150 | $43,880 | $167,270 |
| 2015 | $2,660 | $211,150 | $43,880 | $167,270 |
| 2014 | -- | $208,150 | $40,880 | $167,270 |
| 2013 | -- | $208,150 | $40,880 | $167,270 |
Source: Public Records
Map
Nearby Homes
- 3791 Morningside Pkwy
- 3646 Morningside Pkwy
- 3721 Morningside Pkwy
- 3735 Morningside Pkwy
- 2842 Sumac Ave
- 3682 Morningside Pkwy
- NKA Bermuda Rd
- TBD Bermuda Rd
- 3725 Nuthatch St
- 3629 Allison Way Lot 172
- 2922 Savanna Ave Lot 278
- 3425 Nuthatch Street Lot 261
- 3378 Allison Way Lot 256
- 3000 Meadowlark Ave Lot 246
- 2992 Meadowlark Ave Lot 245
- 2904 Meadowlark Ave Lot 234
- 2937 Whitesage Avenue Lot 272
- 2961 Whitesage Avenue Lot 270
- 2973 Whitesage Avenue Lot 269
- 2985 Whitesage Avenue Lot 268
- 2704 S Bermuda Rd
- 3304 S Bermuda Rd
- 3404 S Bermuda Rd
- 2805 S Bermuda Rd
- 3103 S Bermuda Rd
- 3103 S Bermuda Rd Unit 1 acre lot!
- 2854 Sunshine Ridge Rd
- 2866 Sunshine Ridge Rd
- 3503 S Bermuda Rd
- 2504 S Bermuda Rd
- 2878 Sunshine Ridge Rd
- 2830 Sunshine Ridge Rd
- 2866 Sunshine Ridge Rd
- 2842 Sunshine Ridge Rd
- 2890 Sunshine Ridge Rd
- 91901 E Valencia Dr
- 2204 S Bermuda Rd
- 2988 Sunshine Ridge Rd
- 2502 E Valencia Dr
- 2902 Sunshine Ridge Rd