2804 Shelly Ln Aurora, IL 60504
Waubonsie NeighborhoodEstimated Value: $239,236 - $254,000
2
Beds
2
Baths
1,044
Sq Ft
$237/Sq Ft
Est. Value
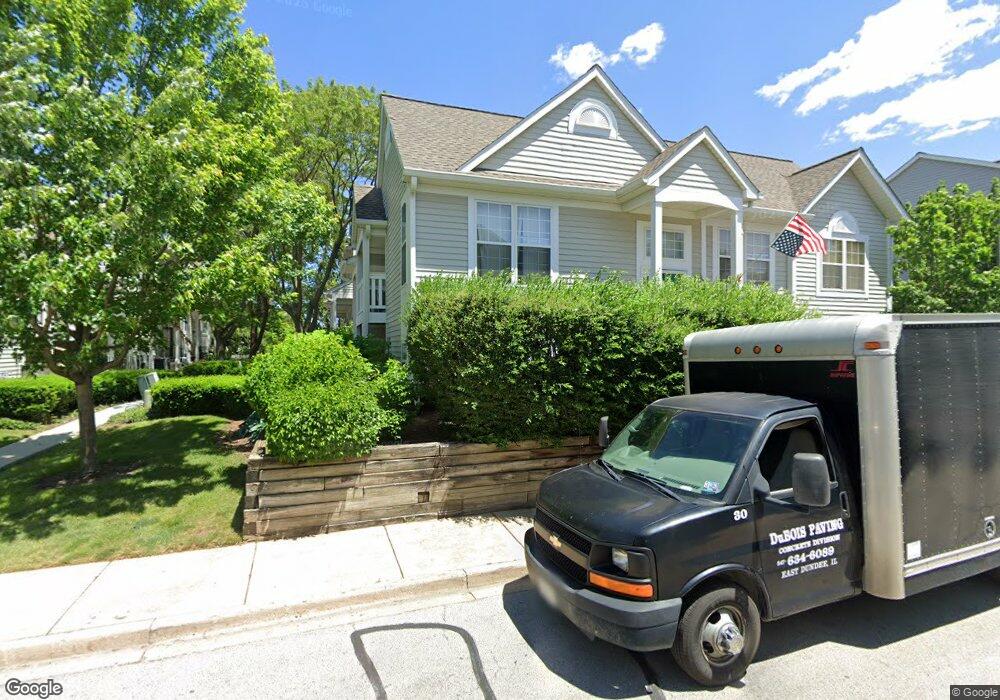
About This Home
This home is located at 2804 Shelly Ln, Aurora, IL 60504 and is currently estimated at $247,309, approximately $236 per square foot. 2804 Shelly Ln is a home located in DuPage County with nearby schools including McCarty Elementary School, Fischer Middle School, and Waubonsie Valley High School.
Ownership History
Date
Name
Owned For
Owner Type
Purchase Details
Closed on
Jun 1, 2009
Sold by
Curran Sara J and Curran Nicholas A
Bought by
Mccrimon Cantranette
Current Estimated Value
Home Financials for this Owner
Home Financials are based on the most recent Mortgage that was taken out on this home.
Original Mortgage
$130,099
Outstanding Balance
$82,552
Interest Rate
4.85%
Mortgage Type
FHA
Estimated Equity
$164,757
Purchase Details
Closed on
Jun 20, 2002
Sold by
Jensen Kelly L
Bought by
Burnett Sara J
Home Financials for this Owner
Home Financials are based on the most recent Mortgage that was taken out on this home.
Original Mortgage
$101,600
Interest Rate
6.87%
Purchase Details
Closed on
Sep 10, 1996
Sold by
First Bank & Trust Company
Bought by
Jensen Kelly J
Home Financials for this Owner
Home Financials are based on the most recent Mortgage that was taken out on this home.
Original Mortgage
$72,000
Interest Rate
7.75%
Create a Home Valuation Report for This Property
The Home Valuation Report is an in-depth analysis detailing your home's value as well as a comparison with similar homes in the area
Home Values in the Area
Average Home Value in this Area
Purchase History
| Date | Buyer | Sale Price | Title Company |
|---|---|---|---|
| Mccrimon Cantranette | $132,500 | None Available | |
| Burnett Sara J | $127,000 | Chicago Title Insurance Co | |
| Jensen Kelly J | $97,000 | -- |
Source: Public Records
Mortgage History
| Date | Status | Borrower | Loan Amount |
|---|---|---|---|
| Open | Mccrimon Cantranette | $130,099 | |
| Previous Owner | Burnett Sara J | $101,600 | |
| Previous Owner | Jensen Kelly J | $72,000 |
Source: Public Records
Tax History
| Year | Tax Paid | Tax Assessment Tax Assessment Total Assessment is a certain percentage of the fair market value that is determined by local assessors to be the total taxable value of land and additions on the property. | Land | Improvement |
|---|---|---|---|---|
| 2024 | $3,921 | $59,574 | $14,891 | $44,683 |
| 2023 | $3,700 | $53,530 | $13,380 | $40,150 |
| 2022 | $3,568 | $48,550 | $12,040 | $36,510 |
| 2021 | $3,463 | $46,820 | $11,610 | $35,210 |
| 2020 | $3,505 | $46,820 | $11,610 | $35,210 |
| 2019 | $3,366 | $44,530 | $11,040 | $33,490 |
| 2018 | $2,510 | $34,420 | $8,700 | $25,720 |
| 2017 | $2,455 | $33,250 | $8,400 | $24,850 |
| 2016 | $2,228 | $30,100 | $7,600 | $22,500 |
| 2015 | $2,184 | $28,580 | $7,220 | $21,360 |
| 2014 | $2,131 | $27,390 | $6,930 | $20,460 |
| 2013 | $2,112 | $27,580 | $6,980 | $20,600 |
Source: Public Records
Map
Nearby Homes
- 2797 Shelly Ln
- 2750 Shelly Ln
- 2901 Shelly Ln
- 2950 Shelly Ln Unit 2950
- 515 Cimarron Dr W Unit 20A
- 3094 Fairfield Ln
- 3140 Medford Ct
- 3115 Village Green Dr
- 2469 Lakeside Dr
- 717 Clarendon Ln
- 3389 Ravinia Cir
- 3033 Anton Cir
- 465 Echo Ln Unit 2
- 23 Westmoor Ct
- 1335 Lawrence Ct
- 2297 Lakeside Dr Unit 10
- 45 Brookshire Ct
- 351 Park Ridge Ln Unit D
- 205 Hidden Pond Cir Unit 31
- 227 Vaughn Rd
- 2806 Shelly Ln
- 2802 Shelly Ln
- 2808 Shelly Ln
- 2808 Shelly Ln Unit 2905
- 2810 Shelly Ln
- 2762 Shelly Ln
- 2764 Shelly Ln
- 2760 Shelly Ln
- 2766 Shelly Ln
- 2768 Shelly Ln
- 2822 Shelly Ln
- 2832 Shelly Ln
- 2824 Shelly Ln
- 2836 Shelly Ln
- 2830 Shelly Ln Unit 25
- 2826 Shelly Ln
- 2795 Shelly Ln
- 2781 Shelly Ln
- 2754 Shelly Ln Unit 25
- 2752 Shelly Ln
Your Personal Tour Guide
Ask me questions while you tour the home.