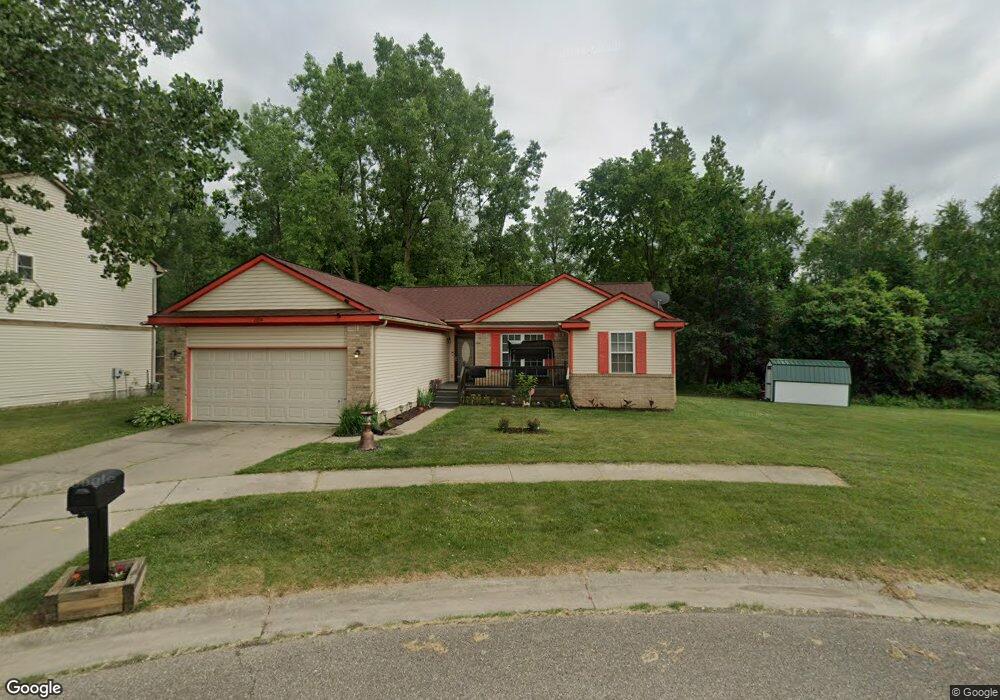
2804 Wilton Place Unit 13 Flint, MI 48506
Northeast Flint NeighborhoodEstimated Value: $88,000 - $172,048
3
Beds
2
Baths
1,327
Sq Ft
$100/Sq Ft
Est. Value
About This Home
This home is located at 2804 Wilton Place Unit 13, Flint, MI 48506 and is currently estimated at $132,512, approximately $99 per square foot. 2804 Wilton Place Unit 13 is a home located in Genesee County with nearby schools including Brownell STEM Academy, Richfield Public School Academy, and Richfield Early Learning Center.
Ownership History
Date
Name
Owned For
Owner Type
Purchase Details
Closed on
Mar 14, 2016
Sold by
Harbour Portfolio Vi Lp
Bought by
Castle Financial Resources Llc
Current Estimated Value
Purchase Details
Closed on
Nov 21, 2012
Sold by
Harbour Portfolio Vi Lp
Bought by
Mccassel Crystal M
Home Financials for this Owner
Home Financials are based on the most recent Mortgage that was taken out on this home.
Original Mortgage
$42,750
Interest Rate
10%
Mortgage Type
Seller Take Back
Purchase Details
Closed on
May 26, 2011
Sold by
Fannie Mae
Bought by
Harbour Portfolio Vi Lp
Purchase Details
Closed on
May 27, 2010
Sold by
Chase Home Finance Llc
Bought by
Federal National Mortgage Association
Purchase Details
Closed on
May 26, 2010
Sold by
Sabin Nicole
Bought by
Chase Home Finance Llc
Purchase Details
Closed on
Aug 15, 2003
Sold by
Windcliff Real Estate Development Co Llc
Bought by
Sabin Nicole
Create a Home Valuation Report for This Property
The Home Valuation Report is an in-depth analysis detailing your home's value as well as a comparison with similar homes in the area
Home Values in the Area
Average Home Value in this Area
Purchase History
| Date | Buyer | Sale Price | Title Company |
|---|---|---|---|
| Castle Financial Resources Llc | -- | None Available | |
| Mccassel Crystal M | $43,750 | None Available | |
| Harbour Portfolio Vi Lp | $12,819 | None Available | |
| Federal National Mortgage Association | -- | None Available | |
| Chase Home Finance Llc | $89,434 | None Available | |
| Sabin Nicole | $118,900 | Cislo Title Company |
Source: Public Records
Mortgage History
| Date | Status | Borrower | Loan Amount |
|---|---|---|---|
| Previous Owner | Mccassel Crystal M | $42,750 |
Source: Public Records
Tax History
| Year | Tax Paid | Tax Assessment Tax Assessment Total Assessment is a certain percentage of the fair market value that is determined by local assessors to be the total taxable value of land and additions on the property. | Land | Improvement |
|---|---|---|---|---|
| 2025 | $2,011 | $57,300 | $0 | $0 |
| 2024 | $1,786 | $44,900 | $0 | $0 |
| 2023 | $1,734 | $31,200 | $0 | $0 |
| 2022 | $0 | $38,200 | $0 | $0 |
| 2021 | $1,874 | $34,800 | $0 | $0 |
| 2020 | $1,653 | $35,800 | $0 | $0 |
| 2019 | $2,973 | $35,800 | $0 | $0 |
| 2018 | $1,668 | $32,800 | $0 | $0 |
| 2017 | $2,322 | $0 | $0 | $0 |
| 2016 | $2,095 | $0 | $0 | $0 |
| 2015 | -- | $0 | $0 | $0 |
| 2014 | -- | $0 | $0 | $0 |
| 2012 | -- | $36,400 | $0 | $0 |
Source: Public Records
Map
Nearby Homes
- 2727 Eaton Place
- 5919 Western Rd
- 5825 Branch Rd
- 3013 Hampstead Dr
- 2806 Epsilon Trail
- 3456 E Pierson Rd
- 1704 E Webster Rd
- 3291 Drexel Ave
- 2935 Richfield Rd
- 5910 N Dort Hwy
- 3017 Richfield Rd
- 00 Richfield Rd
- 3499 E Carpenter Rd
- 5206 Branch Rd
- 3006 Arizona Ave
- 1218 E Piper Ave
- 3210 Wyoming Ave
- 1206 E Home Ave
- 1510 Utah Ave
- 1805 Montana Ave
- 2810 Wilton Place Unit 15
- 2806 Wilton Place Unit 14
- 2803 Wilton Place Unit 10
- 2805 Wilton Place Unit 9
- 2802 Wilton Place
- 5508 Western Rd
- 2813 Wilton Place Unit 7
- 2801 Windrush Pass
- 2801 Wilton Place
- 5614 Western Rd
- 2802 Arendal Dr
- 2811 Tiptree Path
- 2814 Windrush Pass
- 2805 Tiptree Path
- 2720 Wilton Place
- 2801 Tiptree Path
- 2808 Windrush Pass
- 2723 Wilton Place
- 5613 Western Rd
- 2910 Wilton Place Unit 19
Your Personal Tour Guide
Ask me questions while you tour the home.