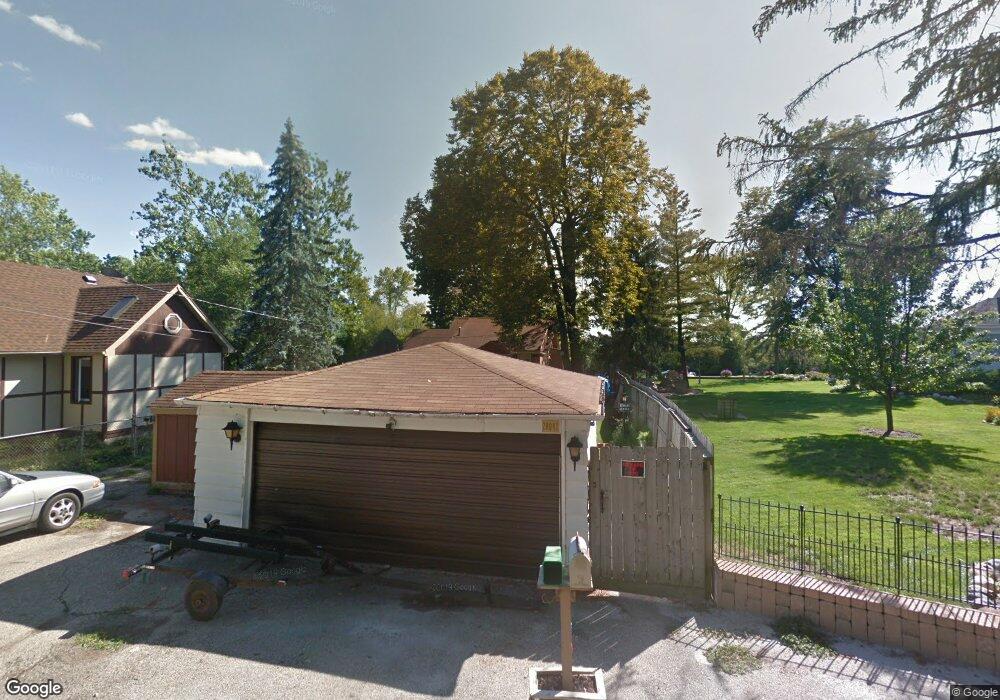
28041 W Belden Ave Spring Grove, IL 60081
Northeast Fox Lake NeighborhoodEstimated Value: $231,000 - $260,000
2
Beds
1
Bath
930
Sq Ft
$261/Sq Ft
Est. Value
About This Home
This home is located at 28041 W Belden Ave, Spring Grove, IL 60081 and is currently estimated at $243,021, approximately $261 per square foot. 28041 W Belden Ave is a home located in Lake County with nearby schools including Lotus Elementary School, Stanton Middle School, and Grant Community High School.
Create a Home Valuation Report for This Property
The Home Valuation Report is an in-depth analysis detailing your home's value as well as a comparison with similar homes in the area
Home Values in the Area
Average Home Value in this Area
Tax History Compared to Growth
Tax History
| Year | Tax Paid | Tax Assessment Tax Assessment Total Assessment is a certain percentage of the fair market value that is determined by local assessors to be the total taxable value of land and additions on the property. | Land | Improvement |
|---|---|---|---|---|
| 2024 | $4,188 | $67,339 | $14,429 | $52,910 |
| 2023 | $4,189 | $60,296 | $12,920 | $47,376 |
| 2022 | $4,189 | $56,544 | $13,557 | $42,987 |
| 2021 | $3,990 | $52,761 | $12,650 | $40,111 |
| 2020 | $3,914 | $51,304 | $12,301 | $39,003 |
| 2019 | $3,683 | $49,061 | $11,763 | $37,298 |
| 2018 | $3,815 | $49,206 | $13,272 | $35,934 |
| 2017 | $3,720 | $46,836 | $12,633 | $34,203 |
| 2016 | $3,960 | $45,200 | $12,192 | $33,008 |
| 2015 | $3,985 | $44,050 | $11,882 | $32,168 |
| 2014 | $4,196 | $48,175 | $14,901 | $33,274 |
| 2012 | $4,122 | $49,927 | $14,901 | $35,026 |
Source: Public Records
Map
Nearby Homes
- 38480 N 6th Ave
- 27849 W Lake Shore Dr
- 38227 N 3rd Ave
- 38581 N Hillandale Dr
- 28624 W Kendall Ave
- 7215 Viscaya Dr
- 38236 N Lee Ave
- 27726 Hill Dr
- 7108 Granada Ln Unit 280
- 8300 Reva Bay Ln Unit SLIP4
- 8300 Reva Bay Ln Unit SLIP5
- 39175 NW End Dr
- Lots 8 & 9 W Ravine Dr
- Lots 11 & 12 W Ravine Dr
- 38265 N State Park Rd
- 37714 N Nippersink Place
- 37706 N Nippersink Place
- 39091 N Mound Ave
- 149 Forest Ave Unit B
- 61 Aspen Colony Unit 2
- 28031 W Belden Ave
- 28065 W Belden Ave
- 28021 W Belden Ave
- 28011 W Belden Ave
- 28075 W Belden Ave
- 28028 W Belden Ave
- 28001 W Belden Ave
- 38269 N 7th Ave
- 28085 W Belden Ave
- 27983 W Belden Ave
- 28095 W Belden Ave
- 38274 N 8th St
- 38290 N 7th Ave
- 38280 N 8th St
- 38276 N 6th Ave
- 27973 W Lake Shore Dr
- 38292 N 8th St
- 38309 N 7th Ave
- 38310 N 8th St
- 38315 N 7th Ave