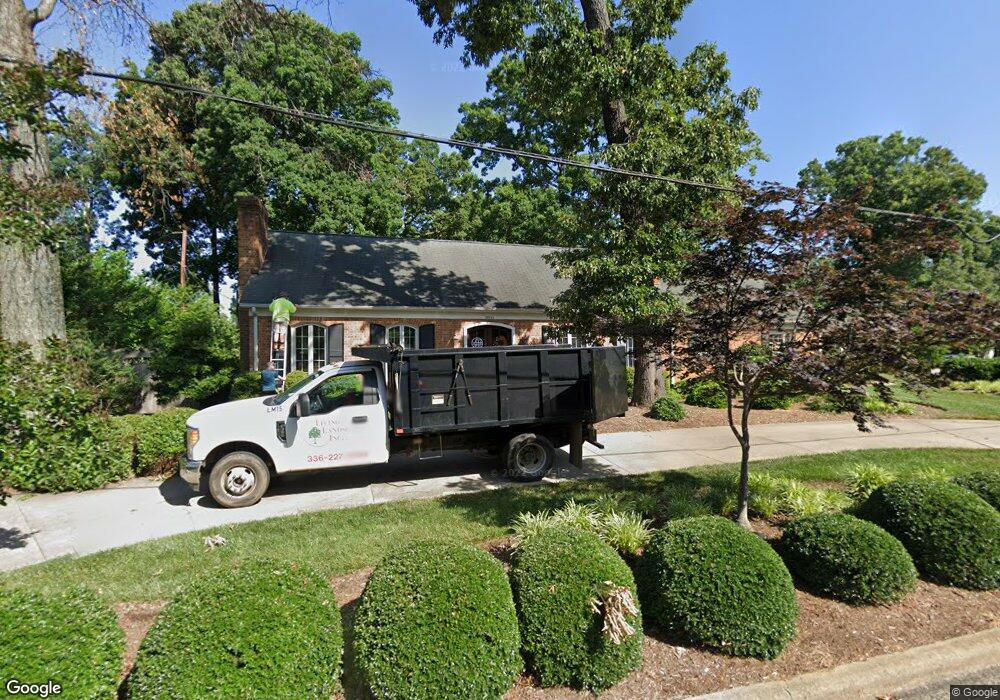
2805 Edgewood Ave Burlington, NC 27215
West Burlington NeighborhoodEstimated Value: $359,000 - $445,000
4
Beds
4
Baths
2,400
Sq Ft
$168/Sq Ft
Est. Value
About This Home
This home is located at 2805 Edgewood Ave, Burlington, NC 27215 and is currently estimated at $403,620, approximately $168 per square foot. 2805 Edgewood Ave is a home located in Alamance County with nearby schools including Marvin B. Smith Elementary School, Turrentine Middle School, and Walter M. Williams High School.
Ownership History
Date
Name
Owned For
Owner Type
Purchase Details
Closed on
Oct 5, 2022
Sold by
Ellis Joseph Walter
Bought by
Alston Andre and Alston Katy
Current Estimated Value
Home Financials for this Owner
Home Financials are based on the most recent Mortgage that was taken out on this home.
Original Mortgage
$150,000
Outstanding Balance
$141,991
Interest Rate
4%
Mortgage Type
New Conventional
Estimated Equity
$261,629
Purchase Details
Closed on
Aug 20, 2020
Sold by
Taylor Elizabeth C and Mehaffey Elizabeth T
Bought by
Ellis Joseph W
Purchase Details
Closed on
May 31, 2006
Sold by
Clark Thomas N
Bought by
Mehaffey Elizabeth T
Home Financials for this Owner
Home Financials are based on the most recent Mortgage that was taken out on this home.
Original Mortgage
$164,720
Interest Rate
6.44%
Mortgage Type
New Conventional
Create a Home Valuation Report for This Property
The Home Valuation Report is an in-depth analysis detailing your home's value as well as a comparison with similar homes in the area
Home Values in the Area
Average Home Value in this Area
Purchase History
| Date | Buyer | Sale Price | Title Company |
|---|---|---|---|
| Alston Andre | $200,000 | -- | |
| Ellis Joseph W | -- | None Available | |
| Mehaffey Elizabeth T | $206,000 | -- |
Source: Public Records
Mortgage History
| Date | Status | Borrower | Loan Amount |
|---|---|---|---|
| Open | Alston Andre | $150,000 | |
| Previous Owner | Mehaffey Elizabeth T | $164,720 | |
| Previous Owner | Mehaffey Elizabeth T | $41,180 |
Source: Public Records
Tax History Compared to Growth
Tax History
| Year | Tax Paid | Tax Assessment Tax Assessment Total Assessment is a certain percentage of the fair market value that is determined by local assessors to be the total taxable value of land and additions on the property. | Land | Improvement |
|---|---|---|---|---|
| 2025 | $1,613 | $326,459 | $45,000 | $281,459 |
| 2024 | $1,531 | $326,459 | $45,000 | $281,459 |
| 2023 | $2,974 | $326,459 | $45,000 | $281,459 |
| 2022 | $2,796 | $225,310 | $45,000 | $180,310 |
| 2021 | $2,819 | $225,310 | $45,000 | $180,310 |
| 2020 | $2,841 | $225,310 | $45,000 | $180,310 |
| 2019 | $2,849 | $225,310 | $45,000 | $180,310 |
| 2018 | $1,339 | $225,310 | $45,000 | $180,310 |
| 2017 | $1,300 | $225,310 | $45,000 | $180,310 |
| 2016 | $2,615 | $225,421 | $50,000 | $175,421 |
| 2015 | $1,301 | $225,421 | $50,000 | $175,421 |
| 2014 | $1,189 | $225,421 | $50,000 | $175,421 |
Source: Public Records
Map
Nearby Homes
- 2804 Edgewood Ave
- 2825 Bedford St
- 2511 Hickory Ave
- 2616 Amherst Ct
- 2941 Amherst Ave
- 818 Colonial Dr
- 3475 Forestdale Dr Unit 2a
- 3489 Forestdale Dr Unit 2d
- 3489 Forestdale Dr Unit 1C
- 3232 Hiddenwood Ln
- 128 Fieldstone Dr
- 115 Coachlight Trail
- 000 Cardwell Dr
- 240 Coachlight Trail
- 2223 Delaney Dr Unit 214
- 2221 #314 Delaney Dr
- 2219 Delaney Dr Unit 314
- 509 Fieldstone Dr
- 713 Mill Pointe Way
- 2808 Armfield Ave
- 2811 Edgewood Ave
- 2729 Edgewood Ave
- 2814 Armfield Ave
- 2810 Bedford St
- 2815 Edgewood Ave
- 2809 Armfield Ave
- 2738 Edgewood Ave
- 2814 Bedford St
- 2725 Edgewood Ave
- 2740 Armfield Ave
- 2821 Edgewood Ave
- 2726 Edgewood Ave
- 2818 Bedford St
- 2722 Bedford St
- 2741 Armfield Ave
- 2805 Bedford St
- 2809 Bedford St
- 2809 Bedford St Unit DT
- 2719 Edgewood Ave