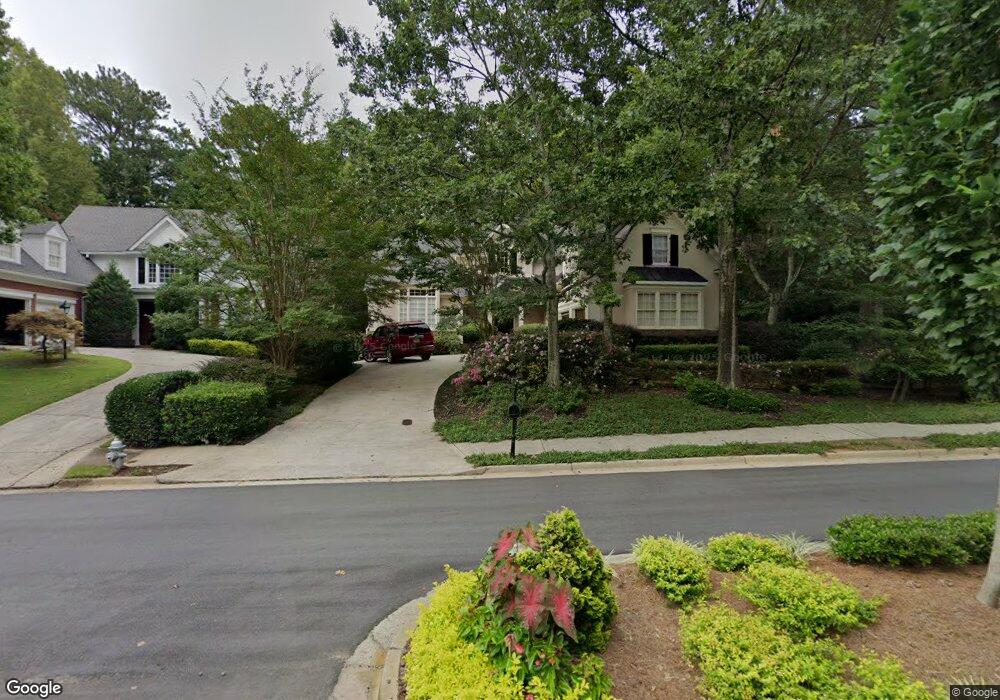
2805 Gleneagles Pointe Alpharetta, GA 30005
Windward NeighborhoodEstimated Value: $863,000 - $946,000
4
Beds
4
Baths
3,551
Sq Ft
$252/Sq Ft
Est. Value
About This Home
This home is located at 2805 Gleneagles Pointe, Alpharetta, GA 30005 and is currently estimated at $895,465, approximately $252 per square foot. 2805 Gleneagles Pointe is a home located in Fulton County with nearby schools including Creek View Elementary School, Webb Bridge Middle School, and Alpharetta High School.
Ownership History
Date
Name
Owned For
Owner Type
Purchase Details
Closed on
Mar 21, 2012
Sold by
Gurganus Thomas E
Bought by
Carter Ryan and Carter Kathryn N
Current Estimated Value
Purchase Details
Closed on
May 25, 2000
Sold by
Kennedy Archibald D and Kennedy Penelope L
Bought by
Gurganus Thomas E and Gurganus Esther H
Home Financials for this Owner
Home Financials are based on the most recent Mortgage that was taken out on this home.
Original Mortgage
$250,000
Interest Rate
8.54%
Mortgage Type
New Conventional
Purchase Details
Closed on
May 10, 1994
Sold by
South Colony Assoc
Bought by
Kennedy Archibald D Penelo
Home Financials for this Owner
Home Financials are based on the most recent Mortgage that was taken out on this home.
Original Mortgage
$203,150
Interest Rate
4.87%
Create a Home Valuation Report for This Property
The Home Valuation Report is an in-depth analysis detailing your home's value as well as a comparison with similar homes in the area
Home Values in the Area
Average Home Value in this Area
Purchase History
| Date | Buyer | Sale Price | Title Company |
|---|---|---|---|
| Carter Ryan | $338,000 | -- | |
| Gurganus Thomas E | $315,100 | -- | |
| Kennedy Archibald D Penelo | $47,500 | -- | |
| South Colony Assoc | $47,600 | -- |
Source: Public Records
Mortgage History
| Date | Status | Borrower | Loan Amount |
|---|---|---|---|
| Previous Owner | Gurganus Thomas E | $250,000 | |
| Previous Owner | South Colony Assoc | $203,150 |
Source: Public Records
Tax History Compared to Growth
Tax History
| Year | Tax Paid | Tax Assessment Tax Assessment Total Assessment is a certain percentage of the fair market value that is determined by local assessors to be the total taxable value of land and additions on the property. | Land | Improvement |
|---|---|---|---|---|
| 2025 | $907 | $317,120 | $86,920 | $230,200 |
| 2023 | $6,607 | $234,080 | $64,800 | $169,280 |
| 2022 | $4,154 | $187,960 | $50,840 | $137,120 |
| 2021 | $4,898 | $182,480 | $49,360 | $133,120 |
| 2020 | $4,925 | $180,320 | $48,760 | $131,560 |
| 2019 | $750 | $169,040 | $45,520 | $123,520 |
| 2018 | $4,152 | $165,080 | $44,440 | $120,640 |
| 2017 | $4,105 | $156,440 | $41,720 | $114,720 |
| 2016 | $4,083 | $156,440 | $41,720 | $114,720 |
| 2015 | $4,798 | $156,440 | $41,720 | $114,720 |
| 2014 | $3,881 | $139,360 | $37,160 | $102,200 |
Source: Public Records
Map
Nearby Homes
- 2825 Gleneagles Pointe
- 2120 Blackheath Trace
- 2485 Hamptons Passage
- 3770 Newport Bay Dr
- 12595 Huntington Trace
- 1170 Greatwood Manor
- 1230 Greatwood Manor
- 3020 Bent Creek Terrace
- 440 Newport Heights
- 5370 McGinnis Ferry Rd
- 2250 Blackheath Trace
- 6000 Greatwood Terrace
- 12470 Concord Hall Dr
- 5510 Vicarage Walk
- 5440 Vicarage Walk
- 13042 Dartmore Ave
- 12981 Dartmore Cir
- 205 Ashebourne Trail
- 5455 Woodrun Ln
- 2805 Glen Eagles Point
- 2805 Glen Eagles Pte
- 2805 Gleneagles Pointe
- 2815 Gleneagles Pointe
- 2815 Glen Eagles Point
- 2815 Gleneagles
- 2815 Glen Eagles Pte
- 2815 Gleneagles Pointe
- 2810 Gleneagles Pointe
- 2210 Hamptons Crossing
- 2820 Glen Eagles Point
- 2800 Gleneagles Pointe
- 2820 Gleneagles Pointe
- 2060 Linkside Dr
- 2050 Linkside Dr
- 2820 Gleneagles Pointe
- 2835 Gleneagles Unit 4
- 2835 Gleneagles
- 2835 Glen Eagles Point
- 2835 Gleneagles Pointe