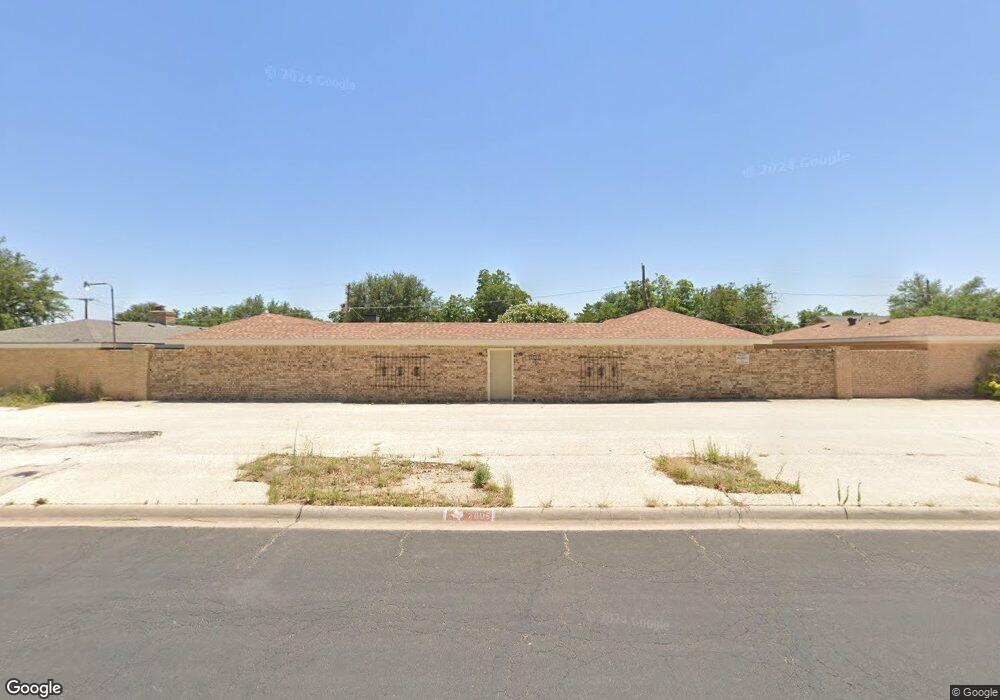
2805 Moss Ave Midland, TX 79705
Estimated Value: $222,000 - $299,527
3
Beds
3
Baths
2,121
Sq Ft
$117/Sq Ft
Est. Value
About This Home
This home is located at 2805 Moss Ave, Midland, TX 79705 and is currently estimated at $247,132, approximately $116 per square foot. 2805 Moss Ave is a home located in Midland County with nearby schools including Emerson Elementary School, Midland High School, and Midland Freshman High School.
Ownership History
Date
Name
Owned For
Owner Type
Purchase Details
Closed on
Jun 2, 2025
Sold by
Phillips Janet
Bought by
Ronquillo Miguel Angel
Current Estimated Value
Home Financials for this Owner
Home Financials are based on the most recent Mortgage that was taken out on this home.
Original Mortgage
$207,100
Outstanding Balance
$206,568
Interest Rate
6.81%
Mortgage Type
New Conventional
Estimated Equity
$40,564
Purchase Details
Closed on
Jan 19, 2006
Sold by
Gerety James and Gerety James Christopher
Bought by
Phillips Janet
Home Financials for this Owner
Home Financials are based on the most recent Mortgage that was taken out on this home.
Original Mortgage
$24,500
Interest Rate
6.25%
Mortgage Type
Stand Alone Second
Purchase Details
Closed on
Jun 4, 2002
Sold by
Reed Martha S Est
Bought by
Phillips Janet
Purchase Details
Closed on
Aug 1, 1986
Bought by
Phillips Janet
Purchase Details
Closed on
Jul 21, 1982
Bought by
Phillips Janet
Create a Home Valuation Report for This Property
The Home Valuation Report is an in-depth analysis detailing your home's value as well as a comparison with similar homes in the area
Purchase History
| Date | Buyer | Sale Price | Title Company |
|---|---|---|---|
| Ronquillo Miguel Angel | -- | West Texas Abstract & Title Co | |
| Phillips Janet | -- | Lone Star Abstract & Title C | |
| Phillips Janet | -- | -- | |
| Phillips Janet | -- | -- | |
| Phillips Janet | -- | -- |
Source: Public Records
Mortgage History
| Date | Status | Borrower | Loan Amount |
|---|---|---|---|
| Open | Ronquillo Miguel Angel | $207,100 | |
| Previous Owner | Phillips Janet | $24,500 |
Source: Public Records
Tax History
| Year | Tax Paid | Tax Assessment Tax Assessment Total Assessment is a certain percentage of the fair market value that is determined by local assessors to be the total taxable value of land and additions on the property. | Land | Improvement |
|---|---|---|---|---|
| 2025 | $3,726 | $245,350 | $32,100 | $213,250 |
| 2024 | $1,529 | $245,540 | $32,100 | $213,440 |
| 2023 | $1,485 | $240,340 | $32,100 | $208,240 |
| 2022 | $3,605 | $230,750 | $32,100 | $198,650 |
| 2021 | $3,891 | $223,350 | $32,100 | $191,250 |
| 2019 | $3,978 | $210,140 | $32,100 | $178,040 |
| 2018 | $3,964 | $203,870 | $32,100 | $172,310 |
| 2017 | $3,604 | $185,340 | $32,100 | $153,240 |
| 2016 | $3,377 | $181,380 | $32,100 | $149,280 |
| 2015 | -- | $181,380 | $32,100 | $149,280 |
| 2014 | -- | $180,500 | $32,100 | $148,400 |
Source: Public Records
Map
Nearby Homes
- 2815 Metz Dr
- 4 Metz Ct
- 2801 Auburn Dr
- 2827 Moss Ave
- 3103 Metz Dr
- 2617 Noel Ave
- 2514 Goddard Dr
- 2515 Emerson Dr
- 2808 Andover Ave
- 2901 Emerson Place
- 2913 Northtown Place
- 2502 Goddard Dr
- 3203 Maxwell Dr
- 2821 Marmon Dr
- 3206 Haynes Dr
- 2800 Durant Dr
- 3002 Moss Ave
- 2505 Maxwell Dr
- 3117 Auburn Dr
- 2811 Durant Dr
Your Personal Tour Guide
Ask me questions while you tour the home.