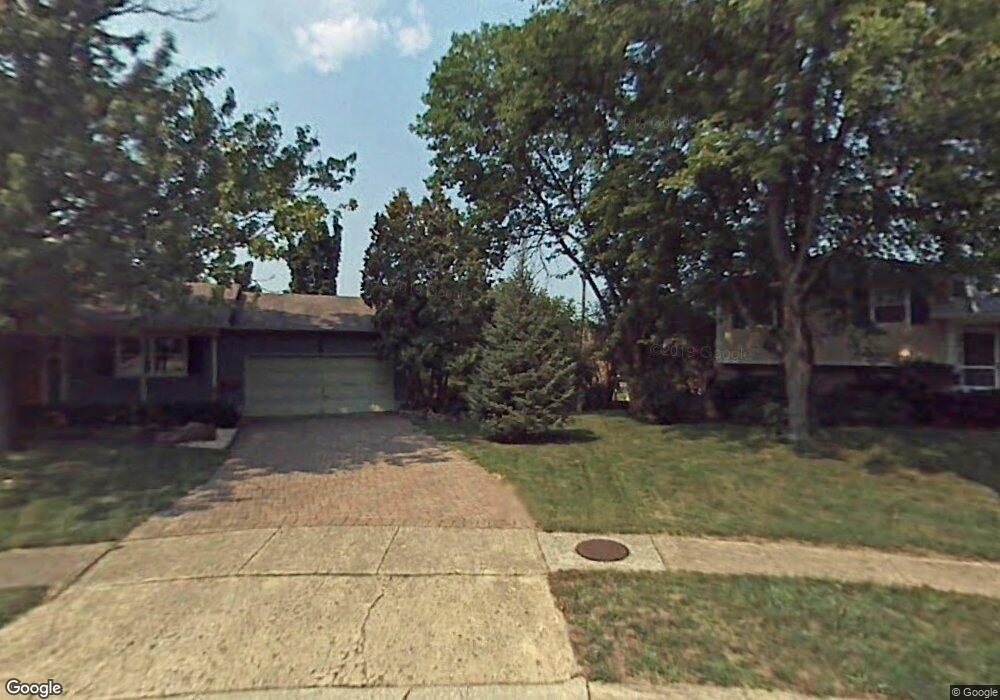
2806 Downing Way Columbus, OH 43221
Estimated Value: $202,000 - $226,300
2
Beds
2
Baths
1,054
Sq Ft
$205/Sq Ft
Est. Value
About This Home
This home is located at 2806 Downing Way, Columbus, OH 43221 and is currently estimated at $216,325, approximately $205 per square foot. 2806 Downing Way is a home located in Franklin County with nearby schools including Tremont Elementary School, Jones Middle School, and Upper Arlington High School.
Ownership History
Date
Name
Owned For
Owner Type
Purchase Details
Closed on
Apr 21, 2023
Sold by
Goudy John Parker
Bought by
Baczek Joanna and Kruse Melissa
Current Estimated Value
Home Financials for this Owner
Home Financials are based on the most recent Mortgage that was taken out on this home.
Original Mortgage
$157,500
Outstanding Balance
$152,894
Interest Rate
6.32%
Mortgage Type
New Conventional
Estimated Equity
$63,431
Purchase Details
Closed on
May 8, 2018
Sold by
Decker Joyce E
Bought by
Goudy John Parker
Home Financials for this Owner
Home Financials are based on the most recent Mortgage that was taken out on this home.
Original Mortgage
$131,920
Interest Rate
4.44%
Mortgage Type
New Conventional
Purchase Details
Closed on
Jun 4, 1991
Bought by
Decker Joyce E
Purchase Details
Closed on
Oct 2, 1989
Purchase Details
Closed on
Jul 1, 1985
Create a Home Valuation Report for This Property
The Home Valuation Report is an in-depth analysis detailing your home's value as well as a comparison with similar homes in the area
Home Values in the Area
Average Home Value in this Area
Purchase History
| Date | Buyer | Sale Price | Title Company |
|---|---|---|---|
| Baczek Joanna | $210,000 | Crown Search Box | |
| Goudy John Parker | $141,000 | Title First Agency Inc | |
| Decker Joyce E | $52,900 | -- | |
| -- | $49,800 | -- | |
| -- | $45,200 | -- |
Source: Public Records
Mortgage History
| Date | Status | Borrower | Loan Amount |
|---|---|---|---|
| Open | Baczek Joanna | $157,500 | |
| Previous Owner | Goudy John Parker | $131,920 |
Source: Public Records
Tax History Compared to Growth
Tax History
| Year | Tax Paid | Tax Assessment Tax Assessment Total Assessment is a certain percentage of the fair market value that is determined by local assessors to be the total taxable value of land and additions on the property. | Land | Improvement |
|---|---|---|---|---|
| 2024 | $3,872 | $66,400 | $19,250 | $47,150 |
| 2023 | $3,796 | $66,400 | $19,250 | $47,150 |
| 2022 | $3,344 | $47,850 | $8,440 | $39,410 |
| 2021 | $2,960 | $47,850 | $8,440 | $39,410 |
| 2020 | $2,934 | $47,850 | $8,440 | $39,410 |
| 2019 | $2,551 | $36,790 | $6,480 | $30,310 |
| 2018 | $1,776 | $36,790 | $6,480 | $30,310 |
| 2017 | $1,929 | $36,790 | $6,480 | $30,310 |
| 2016 | $1,621 | $33,260 | $4,940 | $28,320 |
| 2015 | $1,619 | $33,260 | $4,940 | $28,320 |
| 2014 | $1,621 | $33,260 | $4,940 | $28,320 |
| 2013 | $851 | $33,250 | $4,935 | $28,315 |
Source: Public Records
Map
Nearby Homes
- 2785 Chateau Cir Unit 69
- 2782 Chateau Cir S Unit 45
- 2731 Clifton Rd
- 3190 Kioka Ave
- 3163 S Dorchester Rd
- 2544 Zollinger Rd
- 2527 Wickliffe Rd
- 3441 Sunset Dr
- 2714 Woodstock Rd
- 2565 Nottingham Rd
- 2370 Zollinger Rd
- 3278 Brookview Way Unit 4
- 2979 Avalon Rd
- 3041 Avalon Rd
- 3127 Griggsview Ct
- 2666 Shrewsbury Rd
- 2745 Cranford Rd
- 3159 Griggsview Ct Unit 3159
- 3163 Griggsview Ct
- 2594 Scioto View Ln Unit 2594
- 2806 Downing Way Unit 37
- 2806 Churchill Dr
- 2804 Churchill Dr Unit 32
- 2808 Downing Way Unit 36
- 2802 Churchill Dr Unit 33
- 2802 Downing Way
- 2802 Downing Way Unit 39
- 2807 Downing Way Unit 43
- 2800 Churchill Dr Unit 34
- 2809 Downing Way
- 2809 Downing Way Unit 42
- 2805 Downing Way Unit 44
- 2801 Downing Way Unit 46
- 2811 Downing Way Unit 41
- 2803 Downing Way
- 2808 Churchill Dr Unit 30
- 2800 Downing Way
- 2810 Downing Way Unit 35
- 2810 Churchill Dr
- 2820 Churchill Dr