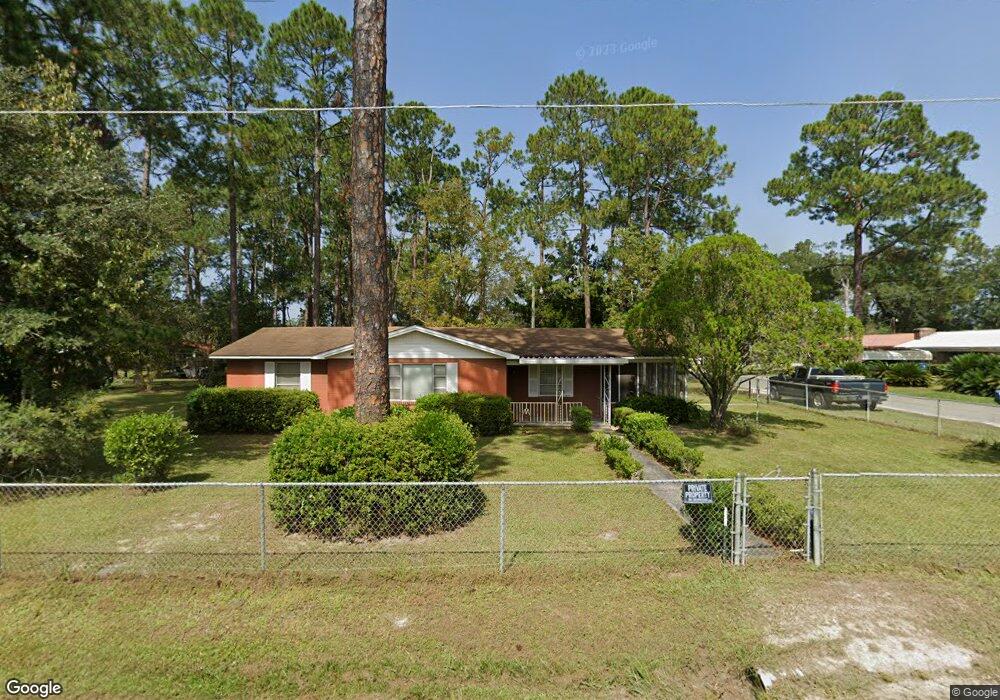
2806 Evergreen Rd Waycross, GA 31503
Estimated Value: $136,000 - $168,000
3
Beds
1
Bath
1,290
Sq Ft
$115/Sq Ft
Est. Value
About This Home
This home is located at 2806 Evergreen Rd, Waycross, GA 31503 and is currently estimated at $148,373, approximately $115 per square foot. 2806 Evergreen Rd is a home located in Ware County with nearby schools including Waresboro Elementary School, Ware County Middle School, and Ware County High School.
Ownership History
Date
Name
Owned For
Owner Type
Purchase Details
Closed on
Jun 13, 2016
Sold by
Cobb Lawanna Mercer
Bought by
Gibbs Trent Alan
Current Estimated Value
Home Financials for this Owner
Home Financials are based on the most recent Mortgage that was taken out on this home.
Original Mortgage
$61,182
Outstanding Balance
$48,694
Interest Rate
3.57%
Mortgage Type
New Conventional
Estimated Equity
$99,679
Purchase Details
Closed on
May 6, 2016
Sold by
Mercer Annie Mae
Bought by
Cobb Lawanna Mercer
Home Financials for this Owner
Home Financials are based on the most recent Mortgage that was taken out on this home.
Original Mortgage
$61,182
Outstanding Balance
$48,694
Interest Rate
3.57%
Mortgage Type
New Conventional
Estimated Equity
$99,679
Purchase Details
Closed on
Jan 1, 2012
Sold by
Mercer Annie Mae
Bought by
Doaa
Purchase Details
Closed on
Nov 28, 2005
Sold by
Cobb Lawanna Mercer
Bought by
Mercer Annie Mae
Purchase Details
Closed on
Mar 17, 2000
Sold by
Mercer Annie Mae
Bought by
Cobb Lawanna Mercer
Create a Home Valuation Report for This Property
The Home Valuation Report is an in-depth analysis detailing your home's value as well as a comparison with similar homes in the area
Home Values in the Area
Average Home Value in this Area
Purchase History
| Date | Buyer | Sale Price | Title Company |
|---|---|---|---|
| Gibbs Trent Alan | $59,500 | -- | |
| Cobb Lawanna Mercer | -- | -- | |
| Doaa | $66,900 | -- | |
| Mercer Annie Mae | -- | -- | |
| Cobb Lawanna Mercer | -- | -- |
Source: Public Records
Mortgage History
| Date | Status | Borrower | Loan Amount |
|---|---|---|---|
| Open | Gibbs Trent Alan | $61,182 |
Source: Public Records
Tax History Compared to Growth
Tax History
| Year | Tax Paid | Tax Assessment Tax Assessment Total Assessment is a certain percentage of the fair market value that is determined by local assessors to be the total taxable value of land and additions on the property. | Land | Improvement |
|---|---|---|---|---|
| 2024 | $643 | $56,446 | $13,140 | $43,306 |
| 2023 | $655 | $34,921 | $3,859 | $31,062 |
| 2022 | $716 | $34,921 | $3,859 | $31,062 |
| 2021 | $728 | $29,121 | $3,859 | $25,262 |
| 2020 | $705 | $24,221 | $3,859 | $20,362 |
| 2019 | $696 | $23,521 | $3,859 | $19,662 |
| 2018 | $757 | $25,201 | $3,859 | $21,342 |
| 2017 | $88 | $25,201 | $3,859 | $21,342 |
| 2016 | $88 | $25,201 | $3,859 | $21,342 |
| 2015 | $89 | $25,200 | $3,859 | $21,342 |
| 2014 | $88 | $25,201 | $3,859 | $21,342 |
| 2013 | -- | $25,200 | $3,859 | $21,341 |
Source: Public Records
Map
Nearby Homes
- 2836 Evergreen Rd
- 2867 Evergreen Rd
- 2857 Cherokee St
- 2885 Longwood Rd
- 850 Woodard Ln
- 1238 Red Keen Rd
- 1261 Lake St
- 2117 Tamara Rd
- 1210 N Augusta Ave
- Lot 155 N Augusta Avenue Cherokee Ave
- 2066 Cherokee St
- 1300 Stanton Ave
- 1803 Lamar Ave
- 2180 Fulford Rd Unit n/a
- 0 Anita South St
- 2869 Ben St
- 2879 Ben St
- 2885 Ben St
- 221 Sierra Ln
- 274 S Anita St
- 2818 Evergreen Rd
- 1399 Crestridge Rd
- 2803 Edgewood Rd
- 2819 Edgewood Rd
- 1448 Crestridge Rd
- 1428 Crestridge Rd
- 2750 Evergreen Rd
- 1379 Crestridge Rd
- 2821 Evergreen Rd
- 2799 Evergreen Rd
- 2829 Edgewood Rd
- 2835 Evergreen Rd
- 1359 Crestridge Rd
- 2747 Evergreen Rd
- 1488 Crestridge Rd
- 2848 Evergreen Rd
- 2839 Edgewood Rd
- 2808 Edgewood Rd
- 1429 Gorman Rd
- 1510 Crestridge Rd