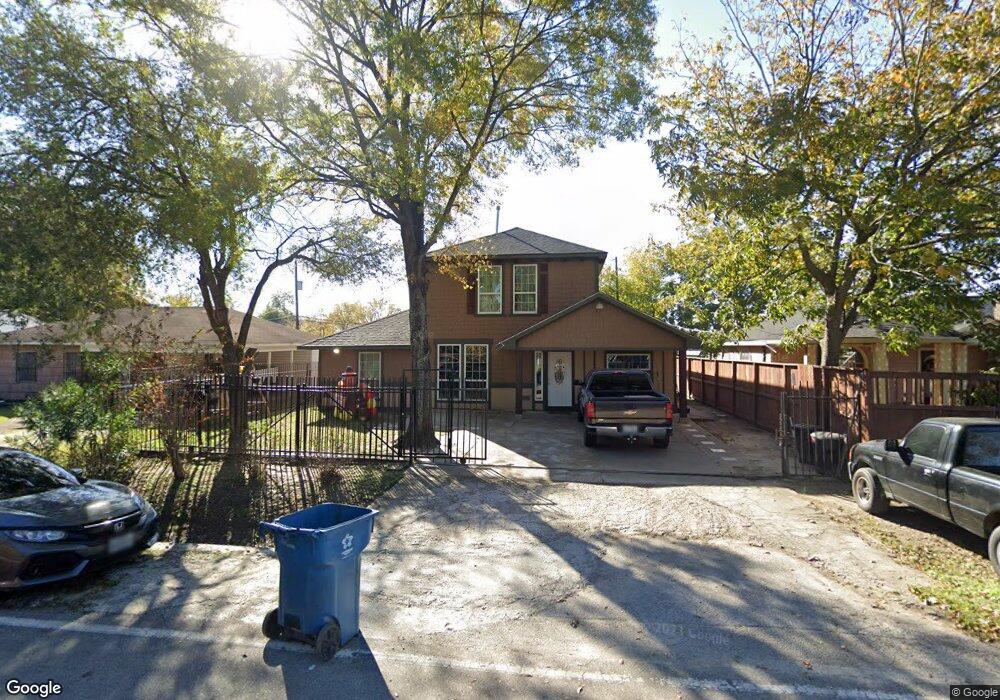
2806 Mohawk St Houston, TX 77093
East Aldine NeighborhoodEstimated Value: $238,000 - $313,000
3
Beds
3
Baths
2,257
Sq Ft
$122/Sq Ft
Est. Value
About This Home
This home is located at 2806 Mohawk St, Houston, TX 77093 and is currently estimated at $275,270, approximately $121 per square foot. 2806 Mohawk St is a home located in Harris County with nearby schools including Scarborough Elementary School, Patrick Henry Middle School, and Sam Houston Math, Science & Technology Center.
Ownership History
Date
Name
Owned For
Owner Type
Purchase Details
Closed on
Oct 5, 2021
Sold by
Garcia Juan Carlos
Bought by
Acosta Rosita
Current Estimated Value
Purchase Details
Closed on
Jul 8, 2021
Sold by
Peralta Juan Carlos and Flor Garcia
Bought by
Garcia Juan Carlos
Purchase Details
Closed on
Aug 25, 2000
Sold by
Soto Jesus and Soto Benita A
Bought by
Peralta Juan C and Peralta Flor
Home Financials for this Owner
Home Financials are based on the most recent Mortgage that was taken out on this home.
Original Mortgage
$55,775
Interest Rate
8.21%
Purchase Details
Closed on
Dec 14, 1995
Sold by
Vera Irene
Bought by
Soto Jesus and Soto Benita A
Purchase Details
Closed on
Apr 24, 1994
Sold by
Manriquez Jorge Heriberto
Bought by
Vera Irene
Purchase Details
Closed on
Jan 28, 1994
Sold by
Medina Ivette Yamil Ayala
Bought by
Manriquez Jorge Heriberto
Create a Home Valuation Report for This Property
The Home Valuation Report is an in-depth analysis detailing your home's value as well as a comparison with similar homes in the area
Home Values in the Area
Average Home Value in this Area
Purchase History
| Date | Buyer | Sale Price | Title Company |
|---|---|---|---|
| Acosta Rosita | -- | None Available | |
| Garcia Juan Carlos | -- | None Listed On Document | |
| Peralta Juan C | -- | Texas American Title Company | |
| Soto Jesus | -- | Chicago Title | |
| Vera Irene | -- | -- | |
| Manriquez Jorge Heriberto | -- | -- |
Source: Public Records
Mortgage History
| Date | Status | Borrower | Loan Amount |
|---|---|---|---|
| Previous Owner | Peralta Juan C | $55,775 |
Source: Public Records
Tax History
| Year | Tax Paid | Tax Assessment Tax Assessment Total Assessment is a certain percentage of the fair market value that is determined by local assessors to be the total taxable value of land and additions on the property. | Land | Improvement |
|---|---|---|---|---|
| 2025 | $5,695 | $324,030 | $40,308 | $283,722 |
| 2024 | $5,695 | $324,030 | $40,308 | $283,722 |
| 2023 | $5,695 | $363,582 | $40,308 | $323,274 |
| 2022 | $5,405 | $290,654 | $30,844 | $259,810 |
| 2021 | $4,421 | $223,969 | $30,844 | $193,125 |
| 2020 | $3,830 | $186,486 | $30,844 | $155,642 |
| 2019 | $3,995 | $186,486 | $30,844 | $155,642 |
| 2018 | $926 | $43,246 | $30,844 | $12,402 |
| 2017 | $926 | $43,246 | $30,844 | $12,402 |
| 2016 | $926 | $43,246 | $30,844 | $12,402 |
| 2015 | $730 | $34,099 | $19,278 | $14,821 |
| 2014 | $730 | $34,099 | $19,278 | $14,821 |
Source: Public Records
Map
Nearby Homes
- 2909 Rosemary Ln
- 2629 Kowis St
- 2530 Kowis St
- 2915 Brea Crest St
- 0 Kowis
- 2527 Lone Oak Rd
- 2636 Lone Oak Rd
- 2523 Lone Oak Rd
- 2311 Warwick Rd
- 3119 Brea Crest St
- 2512 Lone Oak Rd
- 2237 Cromwell St
- 2506 Lone Oak Rd
- 2502 Lone Oak Rd
- 2430 Lone Oak Rd Unit 1
- 3006 Hartwick Rd
- 2414 Lone Oak Rd
- 3007 Trenton Rd
- 1728 Little York Rd
- 3111 Hartwick Rd
- 2810 Mohawk St
- 2802 Mohawk St
- 0 Mohawk Unit 94173098
- 2814 Mohawk St
- 2801 Cromwell St
- 2805 Cromwell St
- 2801 Mohawk St
- 2809 Cromwell St
- 2813 Cromwell St
- 2817 Mohawk St
- 2821 Cromwell St
- 2802 Cromwell St
- 2806 Hopper Rd
- 2821 Mohawk St
- 2810 Hopper Rd
- 2806 Cromwell St
- 2810 Cromwell St
- 2814 Hopper Rd
- 2902 Mohawk St
- 2814 Cromwell St
Your Personal Tour Guide
Ask me questions while you tour the home.