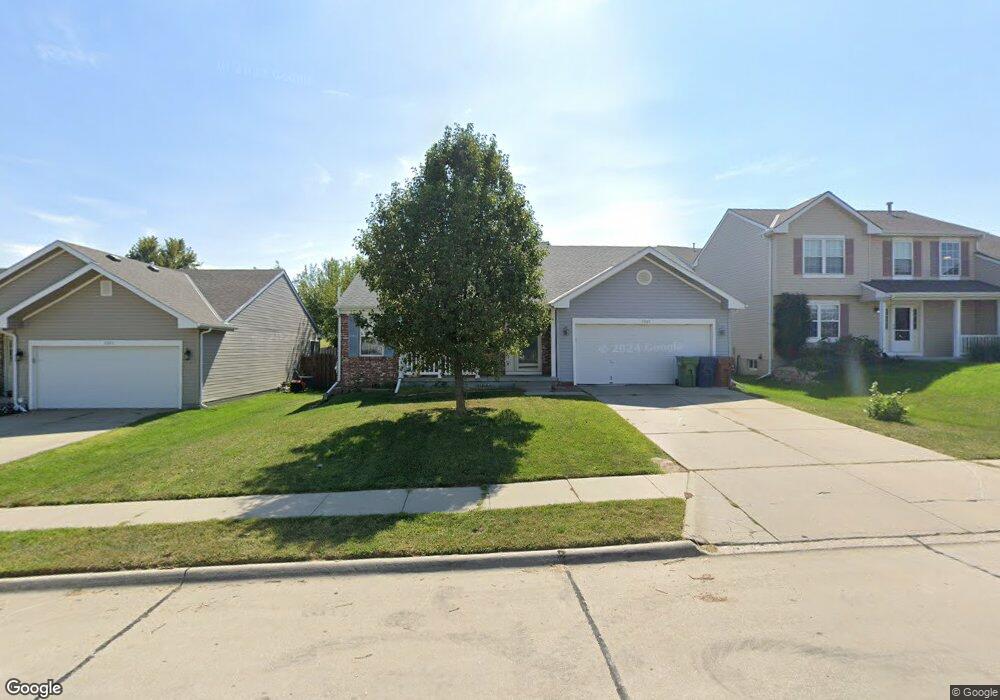
2807 Arrowhead Ln Bellevue, NE 68123
Estimated Value: $279,000 - $314,000
3
Beds
2
Baths
1,402
Sq Ft
$210/Sq Ft
Est. Value
About This Home
This home is located at 2807 Arrowhead Ln, Bellevue, NE 68123 and is currently estimated at $294,352, approximately $209 per square foot. 2807 Arrowhead Ln is a home located in Sarpy County with nearby schools including Two Springs Elementary School, Lewis & Clark Middle School, and Bellevue East High School.
Ownership History
Date
Name
Owned For
Owner Type
Purchase Details
Closed on
Jun 26, 2019
Sold by
The Beasley Funnel Family Trust
Bought by
Evans Sean and Evans Ashley
Current Estimated Value
Home Financials for this Owner
Home Financials are based on the most recent Mortgage that was taken out on this home.
Original Mortgage
$166,920
Outstanding Balance
$146,774
Interest Rate
4%
Mortgage Type
FHA
Estimated Equity
$147,578
Purchase Details
Closed on
Jul 28, 2009
Sold by
Deutsche Bank National Trust Company
Bought by
Beasley Jay N and Beasley Sarah L
Purchase Details
Closed on
Feb 10, 2009
Sold by
Wermuth David W and Wermuth Billie S
Bought by
Deutsche Bank National Trust Company
Purchase Details
Closed on
Nov 1, 2001
Sold by
Hearthstone Homes Inc
Bought by
Wermuth David W and Wermuth Billie S
Home Financials for this Owner
Home Financials are based on the most recent Mortgage that was taken out on this home.
Original Mortgage
$135,000
Interest Rate
6.59%
Create a Home Valuation Report for This Property
The Home Valuation Report is an in-depth analysis detailing your home's value as well as a comparison with similar homes in the area
Home Values in the Area
Average Home Value in this Area
Purchase History
| Date | Buyer | Sale Price | Title Company |
|---|---|---|---|
| Evans Sean | $170,000 | None Available | |
| Beasley Jay N | $143,000 | Bankers & Lenders Title | |
| Deutsche Bank National Trust Company | $151,300 | None Available | |
| Wermuth David W | $138,000 | -- |
Source: Public Records
Mortgage History
| Date | Status | Borrower | Loan Amount |
|---|---|---|---|
| Open | Evans Sean | $166,920 | |
| Previous Owner | Wermuth David W | $135,000 |
Source: Public Records
Tax History Compared to Growth
Tax History
| Year | Tax Paid | Tax Assessment Tax Assessment Total Assessment is a certain percentage of the fair market value that is determined by local assessors to be the total taxable value of land and additions on the property. | Land | Improvement |
|---|---|---|---|---|
| 2025 | $3,950 | $247,465 | $48,000 | $199,465 |
| 2024 | $4,575 | $227,674 | $48,000 | $179,674 |
| 2023 | $4,575 | $216,650 | $44,000 | $172,650 |
| 2022 | $4,388 | $203,890 | $40,000 | $163,890 |
| 2021 | $4,040 | $185,733 | $34,000 | $151,733 |
| 2020 | $3,955 | $181,253 | $34,000 | $147,253 |
| 2019 | $3,916 | $171,373 | $34,000 | $137,373 |
| 2018 | $3,703 | $166,222 | $30,000 | $136,222 |
| 2017 | $3,608 | $160,645 | $30,000 | $130,645 |
| 2016 | $3,444 | $151,638 | $28,000 | $123,638 |
| 2015 | $3,322 | $150,565 | $28,000 | $122,565 |
| 2014 | $3,216 | $144,852 | $28,000 | $116,852 |
| 2012 | -- | $142,429 | $27,000 | $115,429 |
Source: Public Records
Map
Nearby Homes
- 2810 Bar Harbor Dr
- 2923 Blackhawk Dr
- 2939 Lone Tree Rd
- 13403 S 28th St
- 14002 Tregaron Ridge Ave Unit B
- 2512 Nottingham Dr
- 13211 S 26th Ave
- 14112 S 22nd St
- 3113 Tammy St
- 3105 Mirror Cir
- 3309 Lookingglass Dr
- 14415 S 29th St
- 14310 S 30th Ave
- 12901 S 29th Place
- 12722 S 28th Ave
- 3209 Meghan Dr
- 14513 S 28th Cir
- 3504 Sheridan Cir
- 3508 Jason Cir
- 14502 S 22nd St
- 2809 Arrowhead Ln
- 2805 Arrowhead Ln
- 0 Arrowhead Ln
- 13702 S 28th Cir
- 2803 Arrowhead Ln
- 2811 Arrowhead Ln
- 13704 S 28th Cir
- 1904 Raven Ridge Dr
- 1808 Raven Ridge Dr
- 2806 Arrowhead Ln
- 2808 Arrowhead Ln
- 13606 S 29th Cr
- 13606 S 29th Cir
- 2901 Arrowhead Ln
- 2801 Arrowhead Ln
- 2804 Arrowhead Ln
- 13703 S 28th Cir
- 13706 S 28th Cir
- 2802 Arrowhead Ln
- 2709 Arrowhead Ln