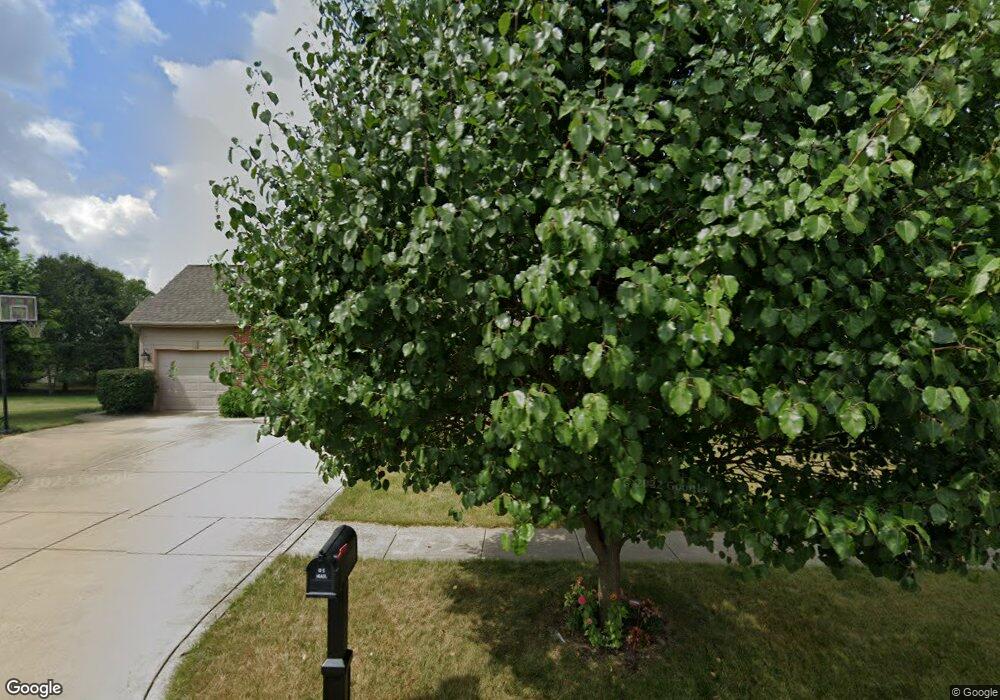
2807 Buckingham Dr Valparaiso, IN 46385
Estimated Value: $487,231 - $583,000
4
Beds
4
Baths
2,931
Sq Ft
$182/Sq Ft
Est. Value
About This Home
This home is located at 2807 Buckingham Dr, Valparaiso, IN 46385 and is currently estimated at $532,808, approximately $181 per square foot. 2807 Buckingham Dr is a home located in Porter County with nearby schools including Northview Elementary School, Ben Franklin Middle School, and Valparaiso High School.
Ownership History
Date
Name
Owned For
Owner Type
Purchase Details
Closed on
Jul 22, 2011
Sold by
Satti John L and Hlava Satti Deanna L
Bought by
Fernando Pitipanage H and Karanuratne Hapuarachchige S
Current Estimated Value
Home Financials for this Owner
Home Financials are based on the most recent Mortgage that was taken out on this home.
Original Mortgage
$199,500
Outstanding Balance
$137,315
Interest Rate
4.52%
Mortgage Type
New Conventional
Estimated Equity
$395,493
Purchase Details
Closed on
Jul 22, 2005
Sold by
Traditional Homes Inc
Bought by
Satti John L and Hlava Satti Deanna L
Home Financials for this Owner
Home Financials are based on the most recent Mortgage that was taken out on this home.
Original Mortgage
$231,252
Interest Rate
5.66%
Mortgage Type
Fannie Mae Freddie Mac
Purchase Details
Closed on
Jan 31, 2005
Sold by
West Wind Corp
Bought by
Traditional Homes Inc
Create a Home Valuation Report for This Property
The Home Valuation Report is an in-depth analysis detailing your home's value as well as a comparison with similar homes in the area
Home Values in the Area
Average Home Value in this Area
Purchase History
| Date | Buyer | Sale Price | Title Company |
|---|---|---|---|
| Fernando Pitipanage H | -- | Professionals Title Services | |
| Satti John L | -- | Ticor Title Insurance | |
| Traditional Homes Inc | -- | Ticor Title Insurance |
Source: Public Records
Mortgage History
| Date | Status | Borrower | Loan Amount |
|---|---|---|---|
| Open | Fernando Pitipanage H | $199,500 | |
| Previous Owner | Satti John L | $231,252 |
Source: Public Records
Tax History Compared to Growth
Tax History
| Year | Tax Paid | Tax Assessment Tax Assessment Total Assessment is a certain percentage of the fair market value that is determined by local assessors to be the total taxable value of land and additions on the property. | Land | Improvement |
|---|---|---|---|---|
| 2024 | $5,228 | $440,700 | $64,300 | $376,400 |
| 2023 | $5,208 | $420,100 | $60,500 | $359,600 |
| 2022 | $4,823 | $382,300 | $60,500 | $321,800 |
| 2021 | $4,650 | $354,000 | $60,500 | $293,500 |
| 2020 | $4,234 | $318,100 | $54,700 | $263,400 |
| 2019 | $4,303 | $318,700 | $54,700 | $264,000 |
| 2018 | $4,174 | $309,700 | $54,700 | $255,000 |
| 2017 | $4,112 | $305,600 | $54,700 | $250,900 |
| 2016 | $3,776 | $306,200 | $49,400 | $256,800 |
| 2014 | $2,900 | $288,000 | $45,800 | $242,200 |
| 2013 | -- | $274,600 | $46,400 | $228,200 |
Source: Public Records
Map
Nearby Homes
- 2802 Buckingham Dr
- 2452 Knights Bridge Dr
- 2801 Westwind Dr
- 2709 Westwind Dr
- 2656 Kerry Dr
- 3002 Winter Garden Dr
- 2804 Beauty Creek Run
- 2955 Spring Rain Ct
- 2551 Kerry Dr
- 2965 Spring Rain Ct
- 2960 Spring Rain Ct
- 3303 Venice Dr
- 3300 Venice Dr
- 2652 Naples Dr
- 2255 Naples Dr
- 2954 Brisbane Dr
- 3400 Venice Dr
- 3310 Pepper Creek Bridge Pkwy
- 3375 Fall Meadows Cir
- 2751 Kildare Courtyard
- 2805 Buckingham Dr
- 2901 Buckingham Dr
- 2806 Prentiss Dr
- 2900 Prentiss Dr
- 2804 Prentiss Dr
- 2806 Buckingham Dr
- 2804 Buckingham Dr
- 2803 Buckingham Dr
- 2900 Buckingham Dr
- 2705 Buckingham Dr
- 0 Buckingham Dr
- 2802 Prentiss Dr
- Lot 2 Prentiss Dr
- Lot 1 Prentiss Dr
- 2801 Buckingham Dr
- 2807 Kickbush Dr
- 2903 Buckingham Dr
- 2807 Prentiss Dr
- 2805 Kickbush Dr
- 2805 Prentiss Dr