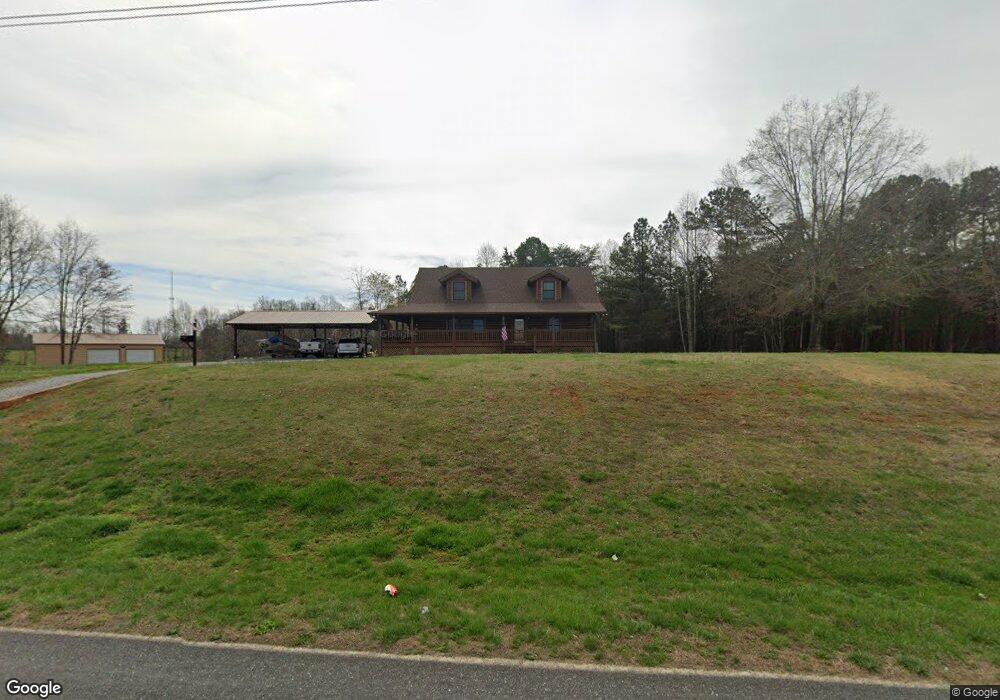
2807 Hollis Rd Shelby, NC 28150
Estimated Value: $243,000 - $315,000
Studio
--
Bath
1,610
Sq Ft
$174/Sq Ft
Est. Value
About This Home
This home is located at 2807 Hollis Rd, Shelby, NC 28150 and is currently estimated at $280,633, approximately $174 per square foot. 2807 Hollis Rd is a home with nearby schools including Union Elementary School, Burns Middle, and Burns High School.
Create a Home Valuation Report for This Property
The Home Valuation Report is an in-depth analysis detailing your home's value as well as a comparison with similar homes in the area
Home Values in the Area
Average Home Value in this Area
Tax History
| Year | Tax Paid | Tax Assessment Tax Assessment Total Assessment is a certain percentage of the fair market value that is determined by local assessors to be the total taxable value of land and additions on the property. | Land | Improvement |
|---|---|---|---|---|
| 2025 | $1,703 | $268,164 | $21,672 | $246,492 |
| 2024 | $1,506 | $179,354 | $17,847 | $161,507 |
| 2023 | $1,499 | $179,354 | $17,847 | $161,507 |
| 2022 | $1,499 | $179,354 | $17,847 | $161,507 |
| 2021 | $1,504 | $179,354 | $17,847 | $161,507 |
| 2020 | $1,255 | $142,742 | $17,077 | $125,665 |
| 2019 | $1,255 | $142,742 | $17,077 | $125,665 |
| 2018 | $1,254 | $143,126 | $17,077 | $126,049 |
| 2017 | $1,248 | $143,126 | $17,077 | $126,049 |
| 2016 | $1,107 | $132,305 | $17,077 | $115,228 |
| 2015 | $1,199 | $143,954 | $14,359 | $129,595 |
| 2014 | $1,199 | $143,954 | $14,359 | $129,595 |
Source: Public Records
Map
Nearby Homes
- 0 W Stage Coach Trail
- 0 Polkville Rd Unit CAR4268038
- 115 S Withrow Dr
- 3687 Ken McEntire Rd
- 3577 Ken McEntire Rd
- 3571 Ken McEntire Rd
- 3567 Ken McEntire Rd
- 4462 1 Hoover Rd
- 3343 Hollis Rd
- 231 London Rd
- 3809 Polkville Rd
- 3326 Crowder Ridge Rd
- 3603 W Stage Coach Trail
- 2412 Daves Dr
- 220 Mount Harmony Church Rd
- 05 Stroud Rd
- 0 Irvin Rd Unit CAR4173999
- 990 Romey Campbell Rd
- 0 Ford Rd
- 0 Jack Moore Mountain Rd
- 00 Hollis Rd
- 4702 Peyton Place
- 2725 Hollis Rd
- 2507 Hollis Rd
- 4718 Peyton Place
- 00 Hollis Rd
- 2718 Hollis Rd
- 2812 Hollis Rd
- 4724 Peyton Place
- 2715 Hollis Rd
- 0 Hollis Rd
- 4728 Peyton Place
- 2709 Hollis Rd
- 2709 Hollis Rd
- 4725 Peyton Place
- 2707 Hollis Rd
- 2705 Hollis Rd
- 4731 Peyton Place
- 4604 Polkville Rd
- 2812 Hollis Rd
Your Personal Tour Guide
Ask me questions while you tour the home.