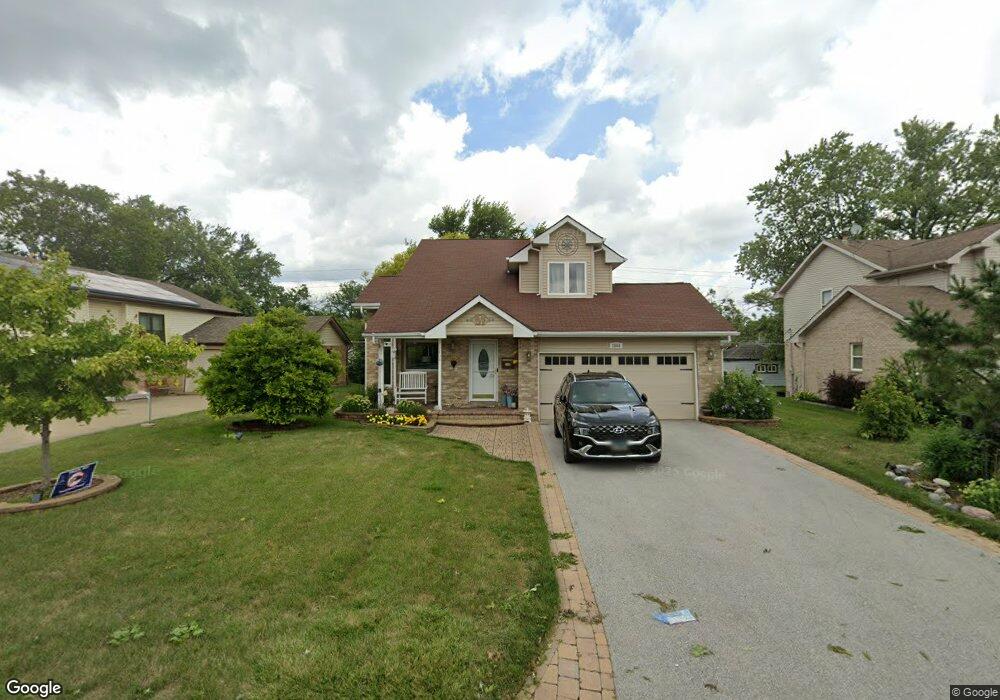
2808 175th St Hazel Crest, IL 60429
Estimated Value: $252,000 - $316,000
3
Beds
2
Baths
1,696
Sq Ft
$158/Sq Ft
Est. Value
About This Home
This home is located at 2808 175th St, Hazel Crest, IL 60429 and is currently estimated at $268,562, approximately $158 per square foot. 2808 175th St is a home located in Cook County with nearby schools including Mae Jemison School, Prairie-Hills Junior High School, and Hillcrest High School.
Ownership History
Date
Name
Owned For
Owner Type
Purchase Details
Closed on
Aug 31, 2011
Sold by
Mathews Melanie T and Mathews Steven W
Bought by
Mathews Melanie T and Mathews Steven W
Current Estimated Value
Purchase Details
Closed on
Jan 29, 2009
Sold by
Boutzarelos
Bought by
Emc Mortgage
Purchase Details
Closed on
Mar 9, 2006
Sold by
Luckett Clifton and Luckett Gala D
Bought by
Boutzarelos John
Home Financials for this Owner
Home Financials are based on the most recent Mortgage that was taken out on this home.
Original Mortgage
$166,500
Interest Rate
6.33%
Mortgage Type
Fannie Mae Freddie Mac
Purchase Details
Closed on
Feb 26, 1999
Sold by
Rose Allen
Bought by
Mack Developers Inc
Create a Home Valuation Report for This Property
The Home Valuation Report is an in-depth analysis detailing your home's value as well as a comparison with similar homes in the area
Home Values in the Area
Average Home Value in this Area
Purchase History
| Date | Buyer | Sale Price | Title Company |
|---|---|---|---|
| Mathews Melanie T | -- | None Available | |
| Emc Mortgage | -- | None Available | |
| Boutzarelos John | $185,000 | Northwest Title & Escrow Cor | |
| Mack Developers Inc | $18,000 | -- |
Source: Public Records
Mortgage History
| Date | Status | Borrower | Loan Amount |
|---|---|---|---|
| Previous Owner | Boutzarelos John | $166,500 |
Source: Public Records
Tax History
| Year | Tax Paid | Tax Assessment Tax Assessment Total Assessment is a certain percentage of the fair market value that is determined by local assessors to be the total taxable value of land and additions on the property. | Land | Improvement |
|---|---|---|---|---|
| 2025 | $10,084 | $23,000 | $2,143 | $20,857 |
| 2024 | $10,084 | $23,000 | $2,143 | $20,857 |
| 2023 | $6,599 | $23,000 | $2,143 | $20,857 |
| 2022 | $6,599 | $12,409 | $1,813 | $10,596 |
| 2021 | $6,424 | $12,409 | $1,813 | $10,596 |
| 2020 | $6,252 | $12,409 | $1,813 | $10,596 |
| 2019 | $6,641 | $13,348 | $1,648 | $11,700 |
| 2018 | $6,432 | $13,348 | $1,648 | $11,700 |
| 2017 | $6,045 | $13,348 | $1,648 | $11,700 |
| 2016 | $5,913 | $12,610 | $1,483 | $11,127 |
| 2015 | $5,594 | $12,610 | $1,483 | $11,127 |
| 2014 | $5,486 | $12,610 | $1,483 | $11,127 |
| 2013 | $6,578 | $16,364 | $1,483 | $14,881 |
Source: Public Records
Map
Nearby Homes
- 2900 175th St
- 2912 175th St
- 2722 Cherrywood Place
- 2711 Larkspur Ln
- 17613 Grandview Dr
- 7 E Carriageway Dr Unit 311
- 17410 Emerson Ave
- 5 E Carriageway Dr Unit 201
- 17622 Oakwood Dr
- 2715 Knollwood Place
- 3004 Longfellow Ave
- 17405 Longfellow Ave
- 3107 Longfellow Ave
- 3100 Longfellow Ave
- 2904 Woodworth Place
- 17714 Dogwood Ln
- 17120 Whittier Ave
- 3107 173rd St
- 17731 Larkspur Ln
- 17742 Larkspur Ln
- 2810 175th St
- 2806 175th St
- 2812 175th St
- 2802 175th St
- 2807 Lexington Dr
- 2809 Lexington Dr
- 2805 Lexington Dr
- 2811 Lexington Dr
- 2803 Lexington Dr
- 2814 175th St
- 2800 175th St
- 2815 Lexington Dr
- 2801 Lexington Dr
- 2816 175th St
- 17500 Oakwood Dr
- 2817 Lexington Dr
- 17502 Oakwood Dr
- 2818 175th St
- 2806 Lexington Dr
- 2808 Lexington Dr
Your Personal Tour Guide
Ask me questions while you tour the home.