2808 Ulmer Rd Columbia, SC 29209
Southeast Columbia NeighborhoodEstimated Value: $175,000 - $265,000
3
Beds
2
Baths
1,504
Sq Ft
$145/Sq Ft
Est. Value
About This Home
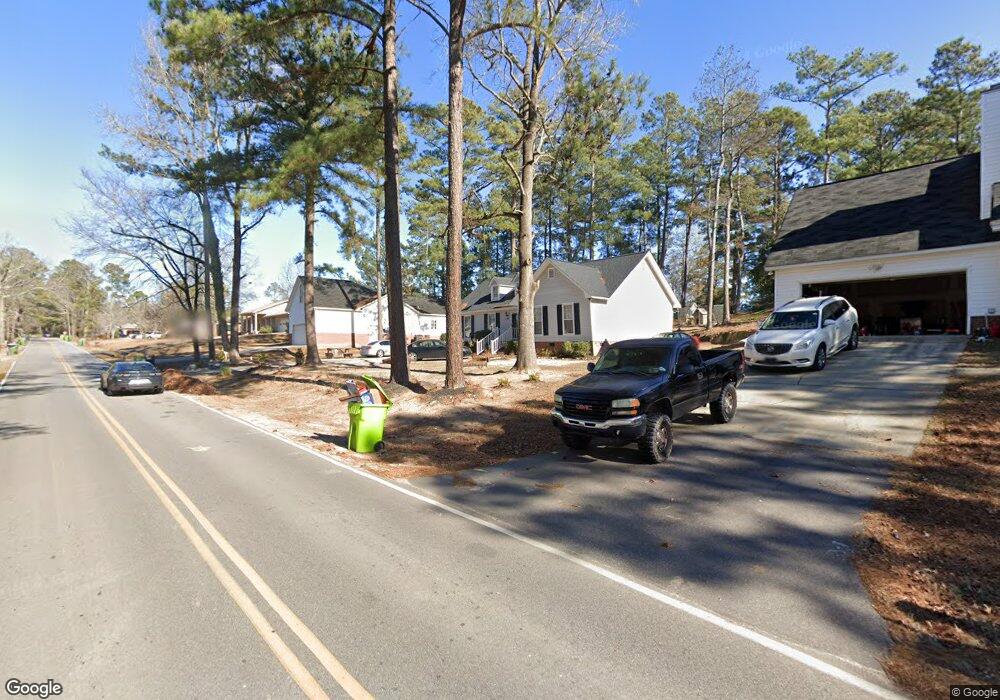
This home is located at 2808 Ulmer Rd, Columbia, SC 29209 and is currently estimated at $218,197, approximately $145 per square foot. 2808 Ulmer Rd is a home located in Richland County with nearby schools including Caughman Road Elementary School, Hopkins Middle School, and Lower Richland High School.
Ownership History
Date
Name
Owned For
Owner Type
Purchase Details
Closed on
Apr 28, 2008
Sold by
Federal Home Loan Mortgage Corporation
Bought by
Brown Crystal E
Current Estimated Value
Home Financials for this Owner
Home Financials are based on the most recent Mortgage that was taken out on this home.
Original Mortgage
$84,333
Interest Rate
6.04%
Mortgage Type
FHA
Purchase Details
Closed on
Jan 22, 2008
Sold by
Jackson Felicia and Gmac Mortgage Llc
Bought by
Federal Home Loan Mortgage Corporation
Purchase Details
Closed on
Jul 30, 1999
Sold by
Peters Mary Ellen and Peters Hal D
Bought by
Jackson Felicia
Home Financials for this Owner
Home Financials are based on the most recent Mortgage that was taken out on this home.
Original Mortgage
$89,767
Interest Rate
7.66%
Mortgage Type
FHA
Purchase Details
Closed on
Jun 30, 1998
Sold by
Peters Mary Ellen and Peters Mary Ellen
Bought by
Peters Mary Ellen and Peters Hal D
Create a Home Valuation Report for This Property
The Home Valuation Report is an in-depth analysis detailing your home's value as well as a comparison with similar homes in the area
Home Values in the Area
Average Home Value in this Area
Purchase History
| Date | Buyer | Sale Price | Title Company |
|---|---|---|---|
| Brown Crystal E | $85,000 | -- | |
| Federal Home Loan Mortgage Corporation | $2,500 | -- | |
| Jackson Felicia | $89,900 | -- | |
| Peters Mary Ellen | -- | -- |
Source: Public Records
Mortgage History
| Date | Status | Borrower | Loan Amount |
|---|---|---|---|
| Previous Owner | Brown Crystal E | $84,333 | |
| Previous Owner | Jackson Felicia | $89,767 |
Source: Public Records
Tax History
| Year | Tax Paid | Tax Assessment Tax Assessment Total Assessment is a certain percentage of the fair market value that is determined by local assessors to be the total taxable value of land and additions on the property. | Land | Improvement |
|---|---|---|---|---|
| 2024 | $1,185 | $119,200 | $0 | $0 |
| 2023 | $1,137 | $4,148 | $0 | $0 |
| 2022 | $1,033 | $103,700 | $19,400 | $84,300 |
| 2021 | $1,027 | $4,150 | $0 | $0 |
| 2020 | $1,042 | $4,150 | $0 | $0 |
| 2019 | $1,015 | $4,150 | $0 | $0 |
| 2018 | $898 | $3,610 | $0 | $0 |
| 2017 | $880 | $3,610 | $0 | $0 |
| 2016 | $877 | $3,610 | $0 | $0 |
| 2015 | $855 | $3,610 | $0 | $0 |
| 2014 | $832 | $90,200 | $0 | $0 |
| 2013 | -- | $3,610 | $0 | $0 |
Source: Public Records
Map
Nearby Homes
- 18 Bedford Ct
- 2101 Bedford Way
- 26 Bedford Ct
- 2701 Cliffside Dr
- 2200 Cardington Dr
- 2608 Banner Hill Rd
- 2812 Cliffside Dr
- 436 Guard Tower Ln
- 14 Shadow Creek Ct
- 96 Ligustrum Ln
- 249 Knight Valley Cir
- 447 Guard Tower Ln
- 8613 Maywood Dr
- 81 Ridge Lake Dr
- 74 Ridge Lake Dr
- 46 Woodwind Ct
- 9533 Commonwealth Blvd
- 9513 Commonwealth Blvd
- 9425 Commonwealth Blvd
- 9509 Commonwealth Blvd
- 2812 Ulmer Rd
- 2804 Ulmer Rd
- 2809 Plymouth Rock Rd
- 2813 Plymouth Rock Rd
- 2816 Ulmer Rd
- 2805 Plymouth Rock Rd
- 2813 Ulmer Rd
- 2817 Ulmer Rd
- 2800 Ulmer Rd
- 2809 Ulmer Rd
- 2817 Plymouth Rock Rd
- 2821 Ulmer Rd
- 2805 Ulmer Rd
- 2825 Ulmer Rd
- 2820 Ulmer Rd
- 2821 Plymouth Rock Rd
- 2219 Emsworth Dr
- 10 Greys Ct
- 2901 Ulmer Rd
- 2801 Plymouth Rock Rd
Your Personal Tour Guide
Ask me questions while you tour the home.