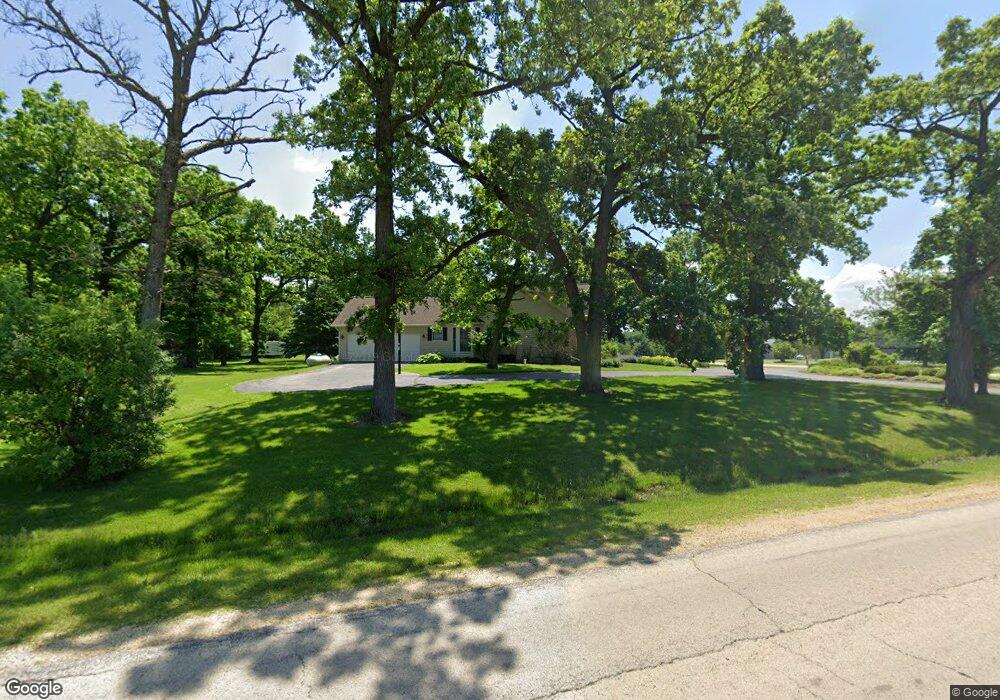
28080 Moose Range Rd Sycamore, IL 60178
Estimated Value: $530,000 - $643,000
3
Beds
3
Baths
2,712
Sq Ft
$218/Sq Ft
Est. Value
About This Home
This home is located at 28080 Moose Range Rd, Sycamore, IL 60178 and is currently estimated at $590,934, approximately $217 per square foot. 28080 Moose Range Rd is a home located in DeKalb County with nearby schools including Sycamore High School and St Mary's Catholic School.
Ownership History
Date
Name
Owned For
Owner Type
Purchase Details
Closed on
Sep 24, 2008
Sold by
Shear James M
Bought by
Finley David and Finley Marsha
Current Estimated Value
Home Financials for this Owner
Home Financials are based on the most recent Mortgage that was taken out on this home.
Original Mortgage
$270,000
Outstanding Balance
$180,746
Interest Rate
6.57%
Mortgage Type
New Conventional
Estimated Equity
$410,188
Create a Home Valuation Report for This Property
The Home Valuation Report is an in-depth analysis detailing your home's value as well as a comparison with similar homes in the area
Home Values in the Area
Average Home Value in this Area
Purchase History
| Date | Buyer | Sale Price | Title Company |
|---|---|---|---|
| Finley David | $400,000 | -- |
Source: Public Records
Mortgage History
| Date | Status | Borrower | Loan Amount |
|---|---|---|---|
| Open | Finley David | $270,000 |
Source: Public Records
Tax History Compared to Growth
Tax History
| Year | Tax Paid | Tax Assessment Tax Assessment Total Assessment is a certain percentage of the fair market value that is determined by local assessors to be the total taxable value of land and additions on the property. | Land | Improvement |
|---|---|---|---|---|
| 2024 | $12,381 | $169,586 | $33,329 | $136,257 |
| 2023 | $12,381 | $154,859 | $30,435 | $124,424 |
| 2022 | $11,792 | $142,033 | $27,914 | $114,119 |
| 2021 | $10,927 | $133,339 | $26,205 | $107,134 |
| 2020 | $10,766 | $130,062 | $25,561 | $104,501 |
| 2019 | $10,580 | $127,212 | $25,001 | $102,211 |
| 2018 | $10,390 | $123,351 | $24,242 | $99,109 |
| 2017 | $10,128 | $118,470 | $23,283 | $95,187 |
| 2016 | $9,867 | $113,066 | $22,221 | $90,845 |
| 2015 | -- | $106,415 | $20,914 | $85,501 |
| 2014 | -- | $101,049 | $19,859 | $81,190 |
| 2013 | -- | $102,985 | $20,239 | $82,746 |
Source: Public Records
Map
Nearby Homes
- Lot 3 Hickory Cir
- Lot 12 Gerry Ln
- 1919 Truman St
- Lot 15 Buckboard Ln Unit A
- Cypress Plan at North Grove Crossings
- Hawthorn Plan at North Grove Crossings
- 513 Amherst Dr
- Lot 14 Crane Ct
- 209 Whittemore Dr
- 218 Whittemore Dr
- 233 Whittemore Dr
- 224 Whittemore Dr
- 708 Nancy Ct
- 495 John Marshall Ln
- 169 Plank Rd
- 223 Merry Oaks Dr
- Lot 4 Williams Cir
- Lot 97 Merry Oaks Dr
- Lot 86 Merry Oaks Dr
- TBD Bethany Rd
- 28110 Moose Range Rd
- 15586 Whipple Rd
- 15586 Whipple Rd
- 15697 Whipple Rd
- 27872 Moose Range Rd
- 15736 Whipple Rd
- 15350 Whipple Rd
- 28367 Moose Range Rd
- 15319 Whipple Rd
- 27707 Moose Range Rd
- 15260 Whipple Rd
- 28500 Moose Range Rd
- 28500 Moose Range Rd
- 15193 Whipple Rd
- 27604 Moose Range Rd
- 15162 Whipple Rd
- 16022 Whipple Rd
- 16038 Whipple Rd
- 16045 Whipple Rd
- 27561 Moose Range Rd