
Landlord's Agent in 2019
Bradley Fox
HomeSmart Connect LLC
(847) 363-9273
4 in this area
150 Total Sales
Estimated Value: $224,000 - $235,000
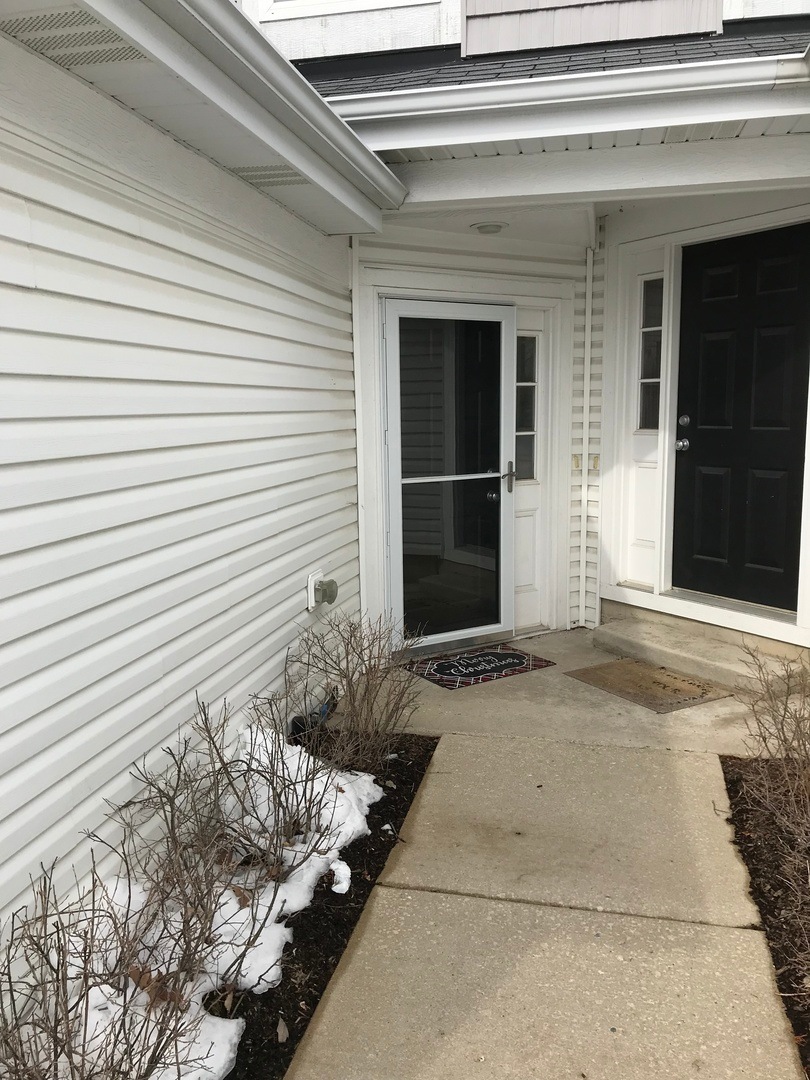
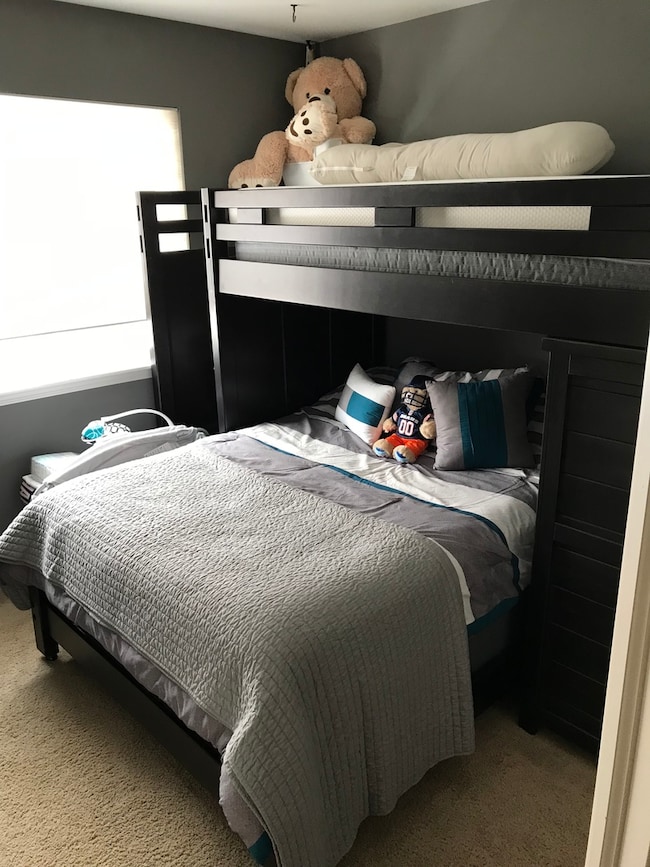
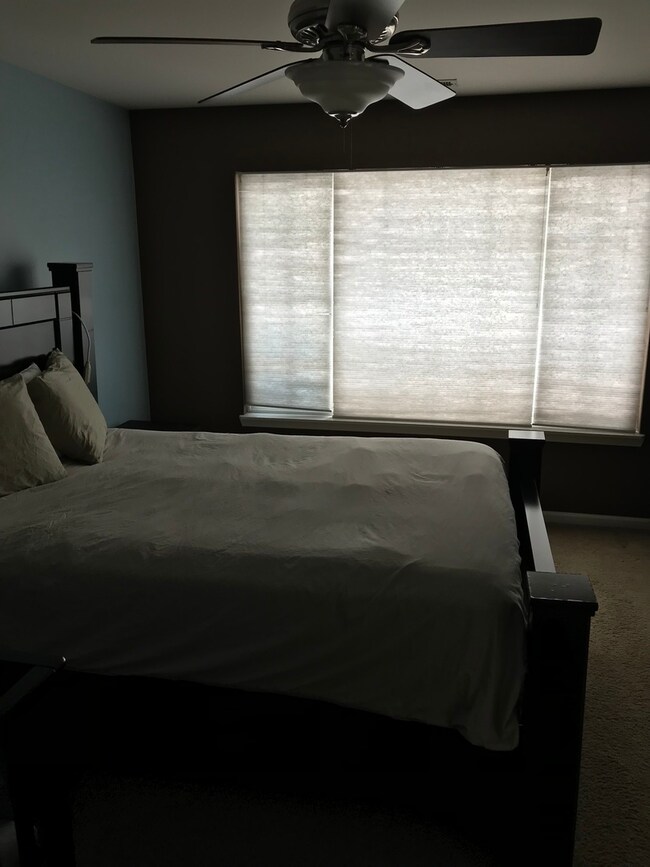
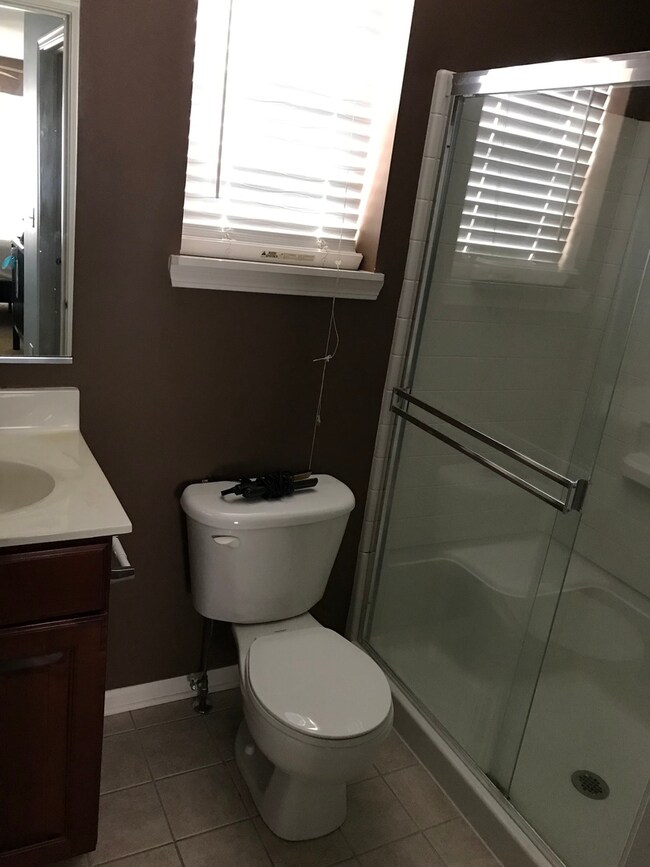
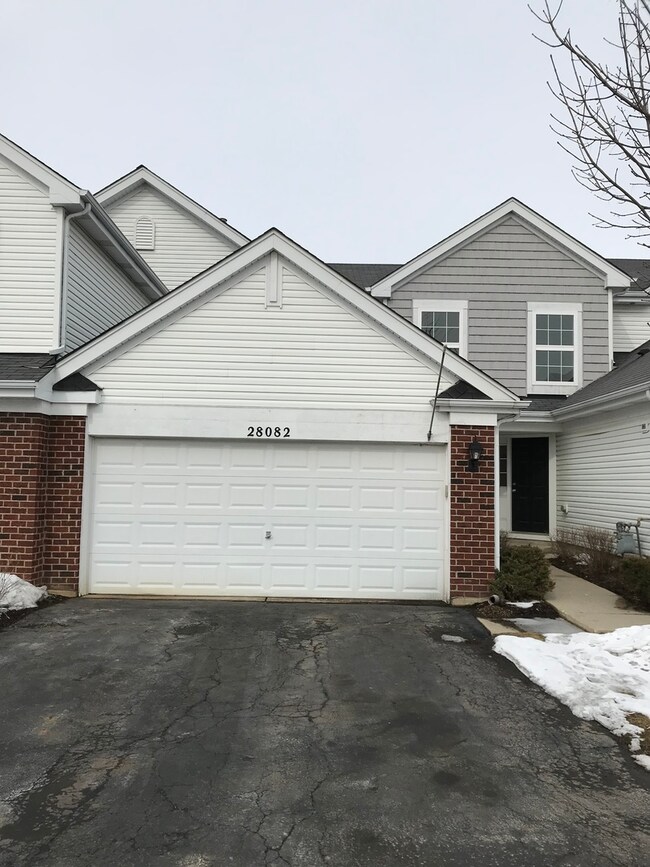
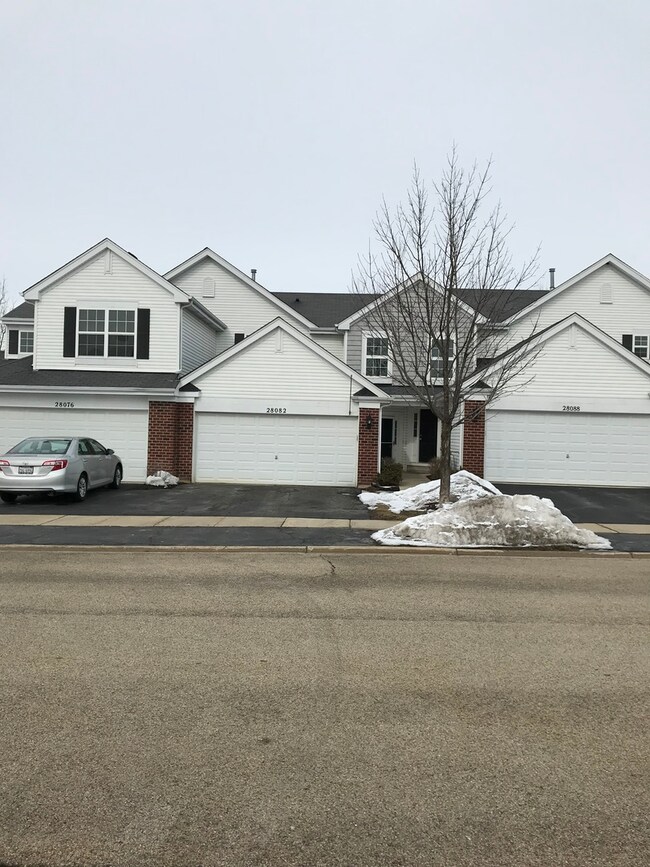
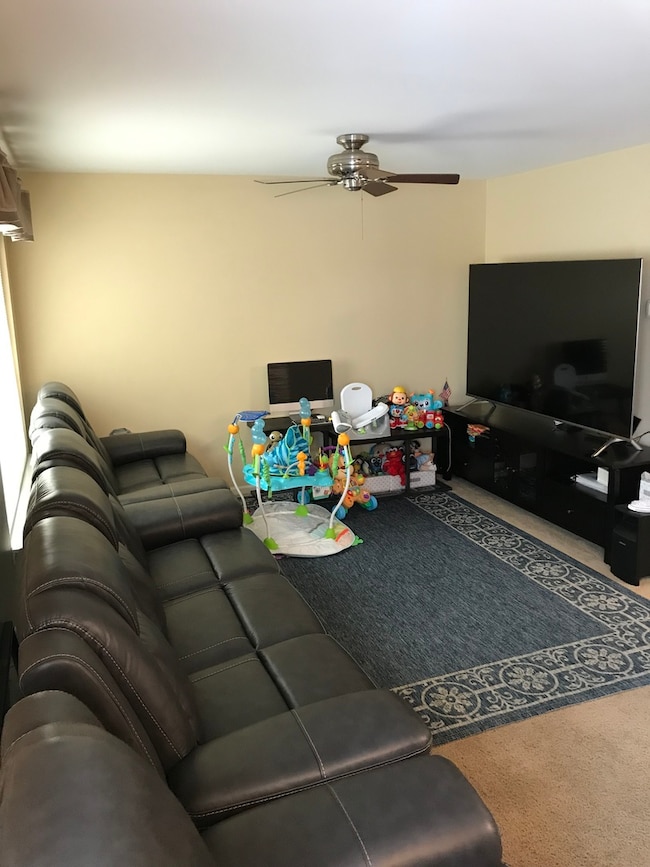
Very nice townhouse rental in Rockwell Place neighborhood. When you walk in, you are greeted with a great room and kitchen with open floor plan. Kitchen has stainless steel appliances. Laundry is located on the second floor with washer and gas dryer. Both bedrooms are located on the 2nd floor. Owner pays for water and sewer. Pets are welcome on a case by case situation. Additional deposit required for pets.
Last Agent to Rent the Property
HomeSmart Connect LLC License #475174075 Listed on: 03/09/2019
| Date | Buyer | Sale Price | Title Company |
|---|---|---|---|
| Diedrich Connor C | $220,000 | Fidelity National Title | |
| Diedrich Morgan | $170,000 | Clark Courtney | |
| Snell Christopher P | -- | First American Title | |
| Snell Christopher P | $189,500 | First American Title Ins Co |
| Date | Status | Borrower | Loan Amount |
|---|---|---|---|
| Open | Diedrich Connor C | $176,000 | |
| Previous Owner | Diedrich Morgan | $161,500 | |
| Previous Owner | Snell Christopher P | $177,315 | |
| Previous Owner | Snell Christopher P | $186,528 |
| Date | Event | Price | List to Sale | Price per Sq Ft |
|---|---|---|---|---|
| 03/18/2019 03/18/19 | Rented | $1,400 | 0.0% | -- |
| 03/09/2019 03/09/19 | For Rent | $1,400 | -- | -- |
| Year | Tax Paid | Tax Assessment Tax Assessment Total Assessment is a certain percentage of the fair market value that is determined by local assessors to be the total taxable value of land and additions on the property. | Land | Improvement |
|---|---|---|---|---|
| 2024 | $4,677 | $59,955 | $7,311 | $52,644 |
| 2023 | $4,616 | $49,534 | $6,888 | $42,646 |
| 2022 | $4,616 | $48,370 | $4,908 | $43,462 |
| 2021 | $4,455 | $45,593 | $4,626 | $40,967 |
| 2020 | $4,472 | $44,941 | $4,560 | $40,381 |
| 2019 | $4,385 | $43,097 | $4,373 | $38,724 |
| 2018 | $3,112 | $29,160 | $4,942 | $24,218 |
| 2017 | $3,031 | $26,953 | $4,568 | $22,385 |
| 2016 | $3,040 | $24,651 | $4,178 | $20,473 |
| 2015 | $2,975 | $23,004 | $3,899 | $19,105 |
| 2014 | $2,560 | $20,011 | $3,723 | $16,288 |
| 2012 | $4,237 | $21,532 | $3,880 | $17,652 |
Landlord's Agent in 2019
Bradley Fox
HomeSmart Connect LLC
(847) 363-9273
4 in this area
150 Total Sales
Tenant's Agent in 2019
Jesus Rico
HomeSmart Connect LLC
(815) 236-4879
15 Total Sales
Source: Midwest Real Estate Data (MRED)
MLS Number: MRD10304215
APN: 05-33-202-013
Disclaimer: Certain information contained herein is derived from information provided by parties other than Homes.com. All information provided is deemed reliable, but is not guaranteed to be accurate and should be independently verified.
![]() Based on information submitted to the MLS GRID. All data is obtained from various sources and may not have been verified by broker or MLS GRID. Supplied Open House Information is subject to change without notice. All information should be independently reviewed and verified for accuracy. Properties may or may not be listed by the office/agent presenting the information. Some IDX listings have been excluded from this website.
Based on information submitted to the MLS GRID. All data is obtained from various sources and may not have been verified by broker or MLS GRID. Supplied Open House Information is subject to change without notice. All information should be independently reviewed and verified for accuracy. Properties may or may not be listed by the office/agent presenting the information. Some IDX listings have been excluded from this website.
The Digital Millennium Copyright Act of 1998, 17 U.S.C. § 512 (the “DMCA”) provides recourse for copyright owners who believe that material appearing on the Internet infringes their rights under U.S. copyright law. If you believe in good faith that any content or material made available in connection with our website or services infringes your copyright, you (or your agent) may send us a notice requesting that the content or material be removed, or access to it blocked.
Notices must be sent in writing by email to DMCAnotice@MLSGrid.com.
The DMCA requires that your notice of alleged copyright infringement include the following information:
(1) description of the copyrighted work that is the subject of claimed infringement;
(2) description of the alleged infringing content and information sufficient to permit us to locate the content;
(3) contact information for you, including your address, telephone number and email address;
(4) a statement by you that you have a good faith belief that the content in the manner complained of is not authorized by the copyright owner, or its agent, or by the operation of any law;
(5) a statement by you, signed under penalty of perjury, that the information in the notification is accurate and that you have the authority to enforce the copyrights that are claimed to be infringed; and
(6) a physical or electronic signature of the copyright owner or a person authorized to act on the copyright owner’s behalf. Failure to include all of the above information may result in the delay of the processing of your complaint.