28089 W Sonoma Pass Unit 1 McHenry, IL 60051
East Lakemoor NeighborhoodEstimated Value: $196,000 - $232,000
2
Beds
2
Baths
1,248
Sq Ft
$176/Sq Ft
Est. Value
About This Home
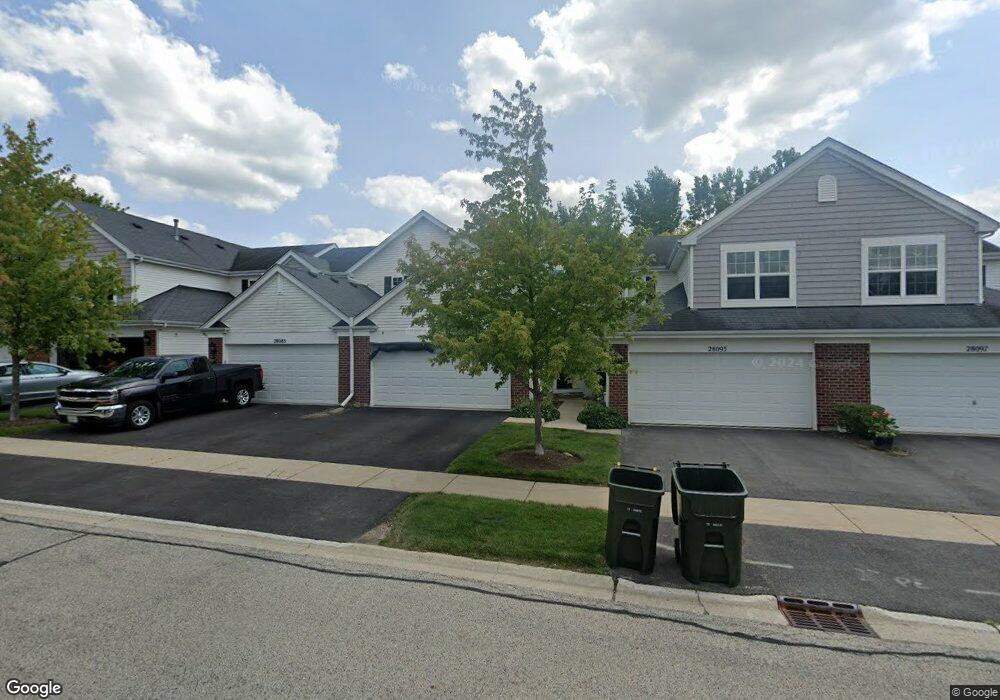
This home is located at 28089 W Sonoma Pass Unit 1, McHenry, IL 60051 and is currently estimated at $219,962, approximately $176 per square foot. 28089 W Sonoma Pass Unit 1 is a home located in Lake County with nearby schools including Big Hollow Primary School, Big Hollow Elementary School, and Big Hollow Middle School.
Ownership History
Date
Name
Owned For
Owner Type
Purchase Details
Closed on
Jun 17, 2024
Sold by
Burns Revocable Living Trust and Burns John
Bought by
John R Burns Living Trust and Kathleen L Burns Living Trust
Current Estimated Value
Purchase Details
Closed on
Feb 15, 2015
Sold by
Burns John and Burns Kathy
Bought by
Burns Revocable Living Trust and Burns Kathy
Purchase Details
Closed on
Feb 22, 2013
Sold by
Nationastar Mortgage Llc
Bought by
Burns John and Burns Kathleen
Purchase Details
Closed on
Nov 29, 2012
Sold by
Mcintosh Corey
Bought by
Nationstar Mortgage Llc
Purchase Details
Closed on
Mar 23, 2007
Sold by
Rockwell Place Llc
Bought by
Mcintosh Corey
Home Financials for this Owner
Home Financials are based on the most recent Mortgage that was taken out on this home.
Original Mortgage
$169,620
Interest Rate
8.95%
Mortgage Type
Purchase Money Mortgage
Create a Home Valuation Report for This Property
The Home Valuation Report is an in-depth analysis detailing your home's value as well as a comparison with similar homes in the area
Home Values in the Area
Average Home Value in this Area
Purchase History
| Date | Buyer | Sale Price | Title Company |
|---|---|---|---|
| John R Burns Living Trust | -- | None Listed On Document | |
| Burns Revocable Living Trust | -- | None Available | |
| Burns John | $56,500 | First American Title | |
| Nationstar Mortgage Llc | -- | None Available | |
| Mcintosh Corey | $170,000 | First American Title Ins Co |
Source: Public Records
Mortgage History
| Date | Status | Borrower | Loan Amount |
|---|---|---|---|
| Previous Owner | Mcintosh Corey | $169,620 |
Source: Public Records
Tax History Compared to Growth
Tax History
| Year | Tax Paid | Tax Assessment Tax Assessment Total Assessment is a certain percentage of the fair market value that is determined by local assessors to be the total taxable value of land and additions on the property. | Land | Improvement |
|---|---|---|---|---|
| 2024 | $3,759 | $59,380 | $7,311 | $52,069 |
| 2023 | $4,203 | $48,667 | $6,888 | $41,779 |
| 2022 | $4,203 | $47,486 | $4,908 | $42,578 |
| 2021 | $4,140 | $44,760 | $4,626 | $40,134 |
| 2020 | $4,128 | $44,120 | $4,560 | $39,560 |
| 2019 | $3,993 | $42,309 | $4,373 | $37,936 |
| 2018 | $2,731 | $29,160 | $4,942 | $24,218 |
| 2017 | $2,671 | $26,953 | $4,568 | $22,385 |
| 2016 | $2,720 | $24,651 | $4,178 | $20,473 |
| 2015 | $2,641 | $23,004 | $3,899 | $19,105 |
| 2014 | $2,315 | $20,011 | $3,723 | $16,288 |
| 2012 | $3,310 | $21,532 | $3,880 | $17,652 |
Source: Public Records
Map
Nearby Homes
- 32448 N Allegheny Way
- 28501 Wagon Trail Ct
- 28200 W Il Route 120
- 28621 Wagon Trail Rd
- 32018 Savannah Dr
- 32069 Savannah Dr
- 32012 Savannah Dr
- 32006 W Savannah Dr
- 32865 N Us Highway 12
- 28808 Blacksmith Ct
- 27 Oyster Bay
- 31782 N Pineview Blvd
- 27419 W Molidor Rd
- 191 Drydock
- 311 Red Oak Cir
- 359 Red Oak Cir
- 277 Red Oak Cir
- Charlotte Plan at Oaks of Volo - Traditional Townhomes
- 289 Red Oak Cir
- Marianne Plan at Oaks of Volo - Traditional Townhomes
- 28097 W Sonoma Pass Unit 136
- 28093 W Sonoma Pass Unit 135
- 28089 W Sonoma Pass Unit 134
- 28085 W Sonoma Pass Unit 133
- 28081 W Sonoma Pass Unit 132
- 28077 W Sonoma Pass Unit 131
- 28085 W Sonoma Pass Unit 1
- 32384 N Allegheny Way Unit 122
- 32380 N Allegheny Way Unit 121
- 32388 N Allegheny Way Unit 123
- 32392 N Allegheny Way Unit 124
- 32370 N Allegheny Way Unit 113
- 32378 N Allegheny Way Unit 111
- 32366 N Allegheny Way Unit 114
- 32386 N Mackinac Ln Unit 251
- 32386 N Mackinac Ln Unit 1
- 32390 N Mackinac Ln Unit 252
- 28101 W Sonoma Pass Unit 141
- 32394 N Mackinac Ln Unit 253
- 32394 N Mackinac Ln Unit 1